

The Mining Business Model
How does the mining industry create value? The answer to that question is provided by the mining business model. But what is a business model?
Here is one definition:
The term “business model” is used to describe how systems and people are organized to create, capture, and deliver value.
Shown below is an illustration of the current business model of Mine Co. Government owns the mineral rights and gives Mine Co a permit to develop and operate a mine. In return royalties and taxes are paid by Mine Co to Government. Mine Co sells products from the mine to buyers. A network of local and international companies supplies Mine Co with the equipment and materials needed to operate the mine. Benefits may arise if there is engagement between Mine Co, Government, and Community. The community determines whether the mining project is granted a “social licence” to operate.

This model has worked well, but has given rise to some notable non-technical risks that suggest some changes are necessary. For example, there could be disagreement between Mine Co and Government about taxes and royalties and unless the disagreement is resolved Government could expropriate the operation. Also, the engagement between Government, Community, and Mine Co should provide benefits to Community resulting from a combination of redistribution of royalties and taxes from Government and initiatives developed by Mine Co. However, there is no guarantee that any part of this combination will happen. A failure to deliver benefits to Community can lead to anti-mining sentiment and disruptions to operations. The common result is that Mine Co becomes subject to high expectations trying to satisfy Government and Community as well as provide value to shareholders.
An alternative model is illustrated below. In this new model, a service company, MaaS Co (Mining as a Service), enters into a contract with a Mineral Rights Owner (MRO) to extract and process minerals which are sold to buyers. The proceeds of the sales are subject to a revenue-sharing agreement between MaaS Co and MRO. Maas Co builds a supply network by means of contracts with both local and remote suppliers. To deliver benefits, MaaS Co and the MRO work with Community to form a local supply chain.
MaaS Co would be in competition with similar companies to be the provider for the MRO. MaaS would achieve competitive advantage through superior application of technology. Further advantage can be achieved by development of innovative engagement schemes with Community and local suppliers, which governments would likely look upon favourably.
This model replaces the non-technical problems with market-based structures. For the model to function over the long-term, the relationship between the MRO and MaaS Co must be a partnership. It cannot be a form of contract mining.

Related People
Scott dunbar.

5 Ways Mining Business Models will Change in the Future
In the past, the mining sector has primarily focused on traditional mining business models to improve productivity. However, trends are now revealing that enabling infrastructure is the central cost in developing new mines. As a result, mining companies now need to look beyond traditional mine development methods (such as geology, mining and processing) and to new strategies to improve productivity and profitability.
Mining IQ has summarized five considerations mining companies should contemplate when creating a mining business model for the future.
1. Cost is only half the equation
Mining companies need to explore how to get better value from the resources they have. While cost is an important element, it’s not everything. Companies should be focusing more on value. The problem with reactive cost-cutting (particularly in the current state of the industry) is it can potentially destroy mine value. A lean and innovative approach to keeping costs down, while focusing on value outputs is needed in order to regain footing.
2. Out with the old, in with the new
The mining industry is currently facing the challenge of using mine development methodology that may have been right for when mines were less remote and less complex, but are now out-dated.
For miners to improve productivity and ROI, they need to get an optimum ‘whole of mine business’ approach, and understand the whole value chain and integrated decisions across that value chain. This can only be achieved effectively by embracing new technologies and innovation.
3. Remove silos across the mining value chain
Like most businesses the mining industry tends to compartmentalize roles and job functions so that manager can control things. As a result silos can be quite common, resulting in bottlenecks in efficiency. Businesses that create integration across the value chain so those managers are removed from their silos and are thinking and being rewarded for the performance across the whole business will make a huge difference to the performance of their mines.
4. Focus on infrastructure and sustainability
In recent years, safety has become the number one important focus across the mining industry, with safety being built into projects. It is now a fundamental part of the way mines are developed and operated. Some might argue that sustainability is the new safety. Having a culture of sustainability will be fundamental to the efficiency of projects, enabling them to be delivered with the best ‘triple bottom line’ outcomes.
5. Embrace new technologies
The emergence of driverless vehicles and remote operating centers has increased efficiencies into the mining sector in terms of being able to manage with fewer resources and costs. Looking towards the future, it will be important for companies to embrace new and emerging technologies and understand how they can impact and improve bottom line efficiencies.
- Brightstar, Eldridge and Claure acquire Ausenco Supply Chain & Operations
- First Quantum contracts with MECS to cut emissions Supply Chain & Operations
- Tin production at Andrada Mining reaches record levels Supply Chain & Operations
- Ternium plans to build US$3.2bn steel plant in Mexico Supply Chain & Operations
Featured Articles

Laws Thwart US Bid to Match China on Lithium Mining
US bid to increase domestic production of lithium in order to reduce reliance on Chinese supplies of critical mineral frustrated by 'confusing' state laws …

Bain: 'Inflation Dampening Mining Leaders' Net Zero Hopes'
Bain & Company’s annual Energy & Natural Resource Executive Survey shows 62% of energy execs say high costs mean net zero goals won't be met by 2060 …
Focus on: Lithium – ‘White Gold’ Driving the EV Revolution
Because of the move to electric vehicles, the metal lithium is rapidly becoming a vitally important part of world’s bid to move away from fossil fuels …
Aluminium Industry Calls for new North America Body
Data-Driven ABB Smart Hoisting Solution 'is Safety Boon'

Deep Sea EV Metals Mining Firm in Greenpeace Clash
- KPMG: Canada Critical Minerals Mining 'Needs tax Breaks'
- Saudi and UAE Oil Companies 'to Produce Lithium for EVs'
- Mining Industry has Long Way to go on Addressing DEI Issue
- KPMG: ESG Chief Worry for Australian Mining Companies
- Exyn Nexys: a 3D Mapping Instrument for Mining Professionals
Developing a Mining Business Case for Investment: Methods
- First Online: 22 November 2019
Cite this chapter

- Michael Seeger 2
503 Accesses
1 Citations
In the current business environment only a strong mining business case will be able to access raised capital. The mining business case, from orebody to market, is fundamental to the success of raising capital for mining project and operations. When the mining business case is strong, large returns can be made for investors, and when it is flawed, large sums of money are lost.
This chapter covers the process of developing a mine, from exploration, feasibility to production and closure, the structure of the business case which is driven by the market and the orebody, the team as an integral part of the success of the business case, legal structuring of the mining business, the financial analysis of the mining business case, valuation methods to enable successful negotiation between the mine developer and the investor, the identification and management of risks in mining, the importance of environmental and social sustainability to attract mining capital against the poor track record of many mining project of the past, the plan and realty of implementing mining projects and importance of questioning and defending the business case to investors.
The business case is summarised in a mining project matrix, which will highlight the strengths to focus on and weaknesses to be addressed, enabling the mine developer to approach the market for capital with confidence.
This is a preview of subscription content, log in via an institution to check access.
Access this chapter
- Available as PDF
- Read on any device
- Instant download
- Own it forever
- Available as EPUB and PDF
- Compact, lightweight edition
- Dispatched in 3 to 5 business days
- Free shipping worldwide - see info
- Durable hardcover edition
Tax calculation will be finalised at checkout
Purchases are for personal use only
Institutional subscriptions
Mining Journal . The Global Mining Finance Guide 2014.
Google Scholar
Sanderson, H. (2018, August). Coal industry between a rock and a hard place. Financial Times.
Seeger, M. (2007). Development of a strategic and tactical game plan for junior mining companies . PhD thesis, University of the Witwatersrand, South Africa.
Caselli, S., & Gatti, S. (2017). Structured finance: Techniques, products and market (2nd ed.). Cham: Springer.
Book Google Scholar
Course Notes. (2005, August). Wits CEE course: Financing of mining projects . Course held at the University of the Witwatersrand.
https://mrmr.cim.org/en/standards/valuation-guidelines-for-mineral-properties/
http://www.valmin.org/
https://www.samcode.co.za/samcode-ssc/samval
Cooper, D., & Chapman, C. (1987). Risk analysis for large projects – Models, methods and cases . Chichester: Wiley.
Seeger, M. (1999). MSc Eng project report: Identification, quantification and simulation of risks facing Greenfields mining projects in sub-Saharan Africa . Johannesburg, South Africa: University of the Witwatersrand.
https://equator-principles.com/
Download references
Author information
Authors and affiliations.
Munich, Germany
Michael Seeger
You can also search for this author in PubMed Google Scholar
Rights and permissions
Reprints and permissions
Copyright information
© 2019 Springer Nature Switzerland AG
About this chapter
Seeger, M. (2019). Developing a Mining Business Case for Investment: Methods. In: Mining Capital. Springer, Cham. https://doi.org/10.1007/978-3-030-31225-1_2
Download citation
DOI : https://doi.org/10.1007/978-3-030-31225-1_2
Published : 22 November 2019
Publisher Name : Springer, Cham
Print ISBN : 978-3-030-31224-4
Online ISBN : 978-3-030-31225-1
eBook Packages : Economics and Finance Economics and Finance (R0)
Share this chapter
Anyone you share the following link with will be able to read this content:
Sorry, a shareable link is not currently available for this article.
Provided by the Springer Nature SharedIt content-sharing initiative
- Publish with us
Policies and ethics
- Find a journal
- Track your research
Breaking Down Bitcoin Mining Business Models
What are self-mining, co-location, and vertical integration in bitcoin mining?

September 8, 2022 November 26, 2023
From at-home mining more than a decade ago to industrial-scale activities powered by gigawatts of capacities, bitcoin mining has come a long way since its inception.
An unprecedented level of capital drawn to the industry over the past year has helped form about 20 publicly listed mining companies with various business models.
Over a decade after Bitcoin’s genesis block, one clear thing is that bitcoin mining has become more vertically integrated than ever.
In the past, miners ran operations at home or in small-scale abandoned factories. Gradually, there came more properly built facilities that lured mining customers.
Some of those facility owners later realized the lucrative side of self-mining and embarked on the journey themselves. Power generators then started to notice how self-mining could bolster their balance sheet and decided to have an extra business stream.
This explainer breaks down mining companies by five business models: Asset-light Mining, Co-location Only, Self-Mining Only, Hybrid Mining, and Vertical Integration.
If you are new to bitcoin mining, we recommend this piece that provides an overview of the bitcoin mining ecosystem .
Asset-Light Mining is a model where a company owns mining equipment but does not fully own mining data centers. They rely on third-party co-location providers to host their equipment and pay hosting fees.
Sometimes, asset-light mining operators may set up a joint venture with a co-location partner or share a portion of their mined bitcoin based on the exact agreements. But the main idea is that they let their hosting partners do the heavy lifting on power sourcing, construction, and maintenance.
Co-location Only refers to a model where a mining data center owner only hosts for customers but does not engage in self-mining. They are responsible for sourcing energy to power their infrastructure and profit from selling such energy capacity to mining customers with markup and charging management fees.
Self-Mining Only, on the other hand, means a mining data center owner completely mines bitcoin for itself and does not allocate any energy capacity to third-party customers. Hence, it solely profits from the production of bitcoin with self-owned mining equipment.
Hybrid Mining is the combination of co-location and self-mining. In such a model, a company typically owns facilities with large power capacities in hundreds of megawatts. To fulfill these capacities with completely proprietary equipment would be extremely expensive. As such, they allocate some energy capacities to host third-party customers while using the remaining capacity for self-mining.
Companies have to rely on credible third-party power producers in any of the four models explained above. But what if a power producer integrates power, infrastructure, and mining equipment? That is what Vertical Integration means in bitcoin mining.
A vertically integrated power producer can be flexible in terms of the utilization of their generated power. They can sell parts of the energy to the grid while self-mining bitcoin with the remaining capacity or provide hosting capacity for customers, or both.
Each business model has unique pros and cons and there are prominent examples in the public market. The table below provides a high-level summary.
- DIGITAL MAGAZINE
- Sign In Log out
- Newsletter signup
- Underground
- Environment
- LATEST HEADLINES
- News Analysis
- Partner Content
- About Mining Magazine
- Frequently Asked Questions
- Terms and Conditions
- Privacy Policy
- Cookie Policy
ENVIRONMENT
Mining's business model 'unviable by 2033'.
Over 40% of mining chief executives believe mining's current business models will become unviable in "10 years or less", according to a survey by PwC.

"Reconfiguring existing supply chains requires enormous levels of new capital."
The findings of PwC's Annual Global CEO Survey suggested that the success of decarbonisation efforts could define mining's future evolution. While 41% of respondents said current business models will...
Already have an account? Sign in here
The definitive guide to mining operations and excellence..
Established in 1909 by Herbert Hoover, Mining Magazine provides comprehensive technical insight into mining operations. It aims to inform and support mine management in decision-making regarding mining techniques, technologies, workforce, logistics, and supply chains.
Standard Subscription
- Global news and analysis
- Exclusive industry columns
- Daily email newsletters
- Monthly digital magazine
Individual, Team and Corporate options available
Premium Subscription
All Standard benefits, plus
- 5x annual Research Reports on key industry topics*
- 4x annual Equities Updates*
*Each valued at £595
RELATED ARTICLES
- Saudi's new law attracts investors as salt flats are put up for grabs
- Does edge computing have a place in a cloud-centric mine?
Spy vs. Spy: US to enlist FBI, CIA in critical minerals race
- Quebec targets pole position in critical minerals circularity race
- NEXT: Mitigating tailings risk with filtering and co-disposal
- PREVIOUS: Mining the top source of environmental conflicts
Get the Mining Magazine Newsletter delivered free each day
From our partners, partner content, integral grinding and crushing solutions that add value, are your pumps putting your production and on-site safety at risk, most popular, msha inspections reveal serious violations at us mines, one every month: tracking the explosion in international critical minerals deals, underground, akobo minerals plans higher gold production in segele's first year, premium subscribers only.
A growing series of reports, each focused on a key discussion point for the mining sector, brought to you by the Mining Magazine Intelligence team.

Mining Magazine Intelligence Future Fleets Report 2024
The report paints a picture of the equipment landscape and includes detailed profiles of mines that are employing these fleets

Mining Magazine Intelligence Digitalisation Report 2023
An in-depth review of operations that use digitalisation technology to drive improvements across all areas of mining production

Mining Magazine Intelligence Automation Report 2023
An in-depth review of operations using autonomous solutions in every region and sector, including analysis of the factors driving investment decisions

Mining Magazine Intelligence Exploration Report 2023 (feat. Opaxe data)
A comprehensive review of current exploration rates, trending exploration technologies, a ranking of top drill intercepts and a catalog of 2022 Initial Resource Estimates and recent discovery successes.
- Newsletter Signup
- Digital Magazine
- Terms And Conditions
THE ASPERMONT BRAND PORTFOLIO

Copyright © 2000-2024 Aspermont Media Ltd. All rights reserved. Aspermont Media is a company registered in England and Wales. Company No. 08096447. VAT No. 136738101. Aspermont Media, WeWork, 1 Poultry, London, England, EC2R 8EJ.
Not a Subscriber?
Subscribe now.
INTEGRATED ANNUAL REPORT

- CORPORATE INFORMATION
- PDF DOWNLOADS
Currently viewing: OUR BUSINESS | Our business model | Next: Material matters
Our business model
Gold Fields has firmly positioned itself as a global diversified gold producer with a quality portfolio of mechanised underground and open-pit mines. Our business model explains how we aim to fulfil our strategic objectives, as well as how we create, preserve or erode value for our stakeholders over time.
- Business Process
OUTCOMES FOR THE BUSINESS AND STAKEHOLDERS DURING 2020
- 5,641 employees
- 12,771 contractors
- Ethical, accountable and transparent leadership
- Attracting and retaining a steady supply of the right skills in a highly competitive environment
- Sourcing the right skills from our host communities
- Increasing the diversity of our leadership teams
- 13,128 TJ of energy consumption
- 21.7 GL water withdrawn
- The impact of climate change on our mines and surrounding communities
- Operating in water-stressed regions
- Security of power supply and cost of energy
- Inclusive Stakeholder Engagement and Relationship Policy
- Sound and transparent working engagements with governments at national, regional and local levels
- Open and honest relationships with our host communities
- The trust gap between mining companies, governments and communities
- US$584m capital expenditure
- US$868m cash generated
- The impact of market sentiment and geopolitical developments on the gold price and foreign exchange rates
- Nine operating mines (including our Asanko JV) and one project
- US$409m sustaining capital and US$175m growth capital
- Strong Mineral Reserves and Resources position
- Ageing infrastructure at our older mines
- Balancing the requirement of modernising our mines with cost reductions
- Innovation and technology that improve cost, safety and productivity
- Modernisation strategy
- Business improvement initiatives
- Developing the right talent to meet the future needs of an increasingly mechanised, modernising and automated mining industry
- Reskilling the existing workforce to ensure we can retain their experience and knowledge
BUSINESS PROCESS
Our active portfolio management approach has enabled us to build a geographically diversified portfolio with nine mines and one project in five countries. We focus on the following elements:
Gold Fields manages its business with the overriding strategic objective to continually improve the quality of its portfolio by lowering All-in costs (AIC), thereby increasing free cash-flow (FCF) margin per ounce of gold produced.
EXPLORATION
Acquiring or developing lower-cost (than Group average), longer-life assets
DEVELOPMENT
Extending the life of current assets through near-mine brownfield exploration
In-country opportunities to leverage off our existing footprint, infrastructure and skills set, and capitalise on the experience we have gained from operating in these jurisdictions
Disposing of higher-cost, shorter-life assets that management believes can be better served by a company that has more time and resources to commit to them
MINE CLOSURE
Environmental stewardship, through which we protect and enhance relationships between our operations and host communities
2.24Moz of attributable gold-eq production 24.8kt of attributable copper production 141Mt mining waste produced
59Mt of tailings waste 10.0Gl of freshwater used 1.942Mt CO 2 e emissions
US$480m paid in salaries and benefits
US$6.8m spent on training and development
One fatal incident
10 deaths among our people (March 2020 – March 2021) due to Covid-19-related illnesses
10 new cases of Silicosis submitted to health authorities
Six serious injuries
20% of our total workforce are women, including women in leadership
Related SDGs
Zero Level 3 – 5 environmental incidents for the second consecutive year
Recycled 71% of water withdrawn and reduced our freshwater intake by 3%
Achieved an A score in the CDP's Water Disclosure Project, demonstrating leadership in water stewardship and reporting transparency
1.97Mt CO 2 e
200Mt of total material moved
All mines, implemented at least 93% of their progressive rehabilitation plans
12 community grievances relating to environmental stewardship
US$17m invested in programmes and projects that benefit our host communities
Employment for 8,752 members of our host communities (53% of our total workforce)
US$536m spent with host community enterprises (29% of total procurement costs)
86% of our employees are from our countries of operation and 96% of all goods and services are procured in-country
US$381m paid to governments in taxes and royalties
139 community grievances
Released our first Report to Stakeholders, providing increased transparency on the impact of our operations on key stakeholders
US$868m in mine cash-flow
US$253m paid in interest and dividends
Net debt decreased to US$1,069m (2019: US$1,664m)
JSE share price up 46%; NYSE share price up 42%
Total dividend of R4.80/ share declared, up 200% from 2019
US$467m in gross mining closure liabilities
US$30m spent on Covid-19-related programmes to assist our employees, communities and governments
US$112m spent on Salares Norte project, with construction ahead of plan
Invested US$50m in near-mine exploration (including Salares Norte)
Damang Reinvestment project in Ghana providing strong returns
South Deep and Cerro Corona closed for a number of days as part of nationwide lockdowns in response to Covid-19
Lost 3.5% of production against original market guidance due to impact of the Covid-19 pandemic
Replaced 103% of depleted Mineral Reserves
Lower production and higher costs at the Cerro Corona mine due to Covid-19-related actions
Continued improvement in production and costs at the South Deep mine amid successful implementation of restructuring initiatives
Completed one of the world’s largest renewable energy microgrids at Agnew and installed a microgrid at Granny Smith
Installed an advanced collision avoidance system in Ghana to reduce worksite accidents and injuries
Continued investment in South Deep, South Africa’s largest bulk, mechanised, underground gold mine
Salares Norte signs contract to instal 26MW microgrid, including 10MW solar
Salares Norte signs contract to use dry-stack tailings, one of the most environmentally responsible tailings solutions
Increased use of real-time data to enable decisions that facilitate safer and more productive mines
Introduction of drones underground for tasks like cavity scanning, remote drill hole surveying and cleaning
Gold Fields Integrated Annual Report 2020
We and our partners use cookies to give you the best online experience, including to personalize content, advertising, and web analytics. You can reject cookies by changing your browser settings. To learn more about the cookies we use see our Cookie Policy .
- Supply Chains
- Manufacturing
- Transportation
- Warehouse Operations
- Rail Logistics
- Ports & Terminals
- Road Traffic
- Passenger Terminals
- Business Processes
- Asset Management
- Social Processes
- Why simulation
- AnyLogic Timeline
- Artificial Intelligence
- Digital Twin
- Enterprise Simulation
- Get started
- White papers
- Case studies
- Training and events
- AnyLogic Conference
- Documentation
- For academia
- Academic articles
- Clients & Testimonials
Mining simulation: business cases and example models
- case studies

In mining, as in any other capital-intensive business, companies need to compare and optimize manufacturing and business processes all the time. For mining companies, a specific challenge increases costs: complex logistics for both raw material handling and mining procurement. Complex logistics are difficult for traditional optimization tools and they can fail to deliver satisfying results. As a result, companies are turning to new solutions.
One of these solutions is mining operation simulation. With it, you can simulate mining or equipment operations. You can also test limits and process changes without substantial costs. In this post, you will find some of the tasks which you can approach using mining simulation.
Extraction volume planning and mine operations analysis
These were the tasks we worked on for one of the largest steel manufacturers. Have a look at the company’s coal mine model: we developed it using standard AnyLogic tools.
This is a typical underground mining model. In it, borers extract ore, which is then transported along a dynamically changing network of conveyors. To develop such a model, we used information on:
- minefield markings
- local geology and drilling
- equipment quantity and performance
- duration and sequence of operations.
We simulated several mine operation scenarios. For each of them, we then estimated potential extraction volumes and possible types of stope formation. Then we calculated equipment load and additional investments to implement the scenarios.
Route planning and logistics scheduling for operations inside and outside mines
With this simulation model, you can optimize vehicle fleet mix and develop the best mine-to-processing-plant ore transportation plan. In the model, you can also reduce delivery costs and increase transportation reliability by recalculating routes in case of truck breakdowns and track blockages.
The model considers production plans, extracted raw materials, and infrastructure facilities, as well as the parameters of all equipment types. With the model, you can test if logistics structures can accommodate raw materials supply. For each structure you can calculate the flow volumes by logistics legs, as well as infrastructure requirements, and equipment and machinery costs. Based on these parameters, the optimal route is calculated.
These are typical tasks that we often solve for our clients in the mining industry and combine into the scenario analysis group.
The group also includes other tasks such as:
- dynamically forecasting ore extraction volumes and reserves;
- synchronizing operations inside and outside mines;
- calculating equipment utilization levels;
- determining the required number of vehicles and renting or equipment leasing period;
- planning equipment maintenance.
We develop all our models in AnyLogic. Its flexibility, integration of GIS maps, agent-based modeling, and advanced 3D animation make it the leading tool for modeling mining operations. You will find examples of such models on our AnyLogic Cloud profile .
More mining simulation case studies >>
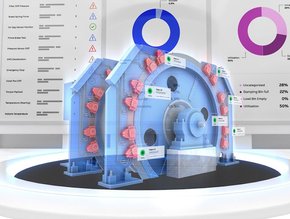
We also recommend looking at the underground mine model (see below), which is among the standard AnyLogic examples that you can find in the software. The model simulates drilling, loading, blasting, ore loading with a dump truck, and ore transportation in the mine. One of the goals of the simulation model is to track equipment load and determine the optimal amount for tunneling operations. Another goal is to clearly show how machinery can cause transport route blockage in a mine. Take a look!
The example model will help you get started with mining operations modeling. The source files are available for download in AnyLogic and in AnyLogic Cloud .
Related posts

Mastering simulation techniques: tips and insights from an AnyLogic expert
Gain valuable insights and simulation tips from Dr. Benjamin Schumann's workshop at the AnyLogic Conference 2023, focusing on understanding simulation modelers’ pains and mastering simulation techniques. Dive into the generic model's hierarchy, key components, and dynamics.

Healthcare optimization: Ops Design innovations with simulation modeling
Discover how DaVita is integrating healthcare optimization into dialysis care. By utilizing simulation modeling, the clinic network is enhancing workflow and dialysis patient care technicians’ collaboration, aiming for superior patient outcomes. Check out the Ops Design team’s insights after their first steps in simulation modeling.

Tackling automotive industry challenges: manufacturing digitalization
Explore how automotive industry consultants leverage simulation modeling for industrial manufacturing optimization. Uncover strategies for strategic alignment, ROI evaluation, and future-proofing business success. Stay at the forefront of innovation as you discover the latest advancements shaping the future of the automotive industry.

Creating a custom simulation object – a robotic crane in AnyLogic software
Discover how to design and add unique objects to your simulations in AnyLogic software using our step-by-step guide. In this blog post, we explain how to do it, using the creation of a custom robotic crane as an example. Explore AnyLogic's capabilities to turn your innovative ideas into reality.

Top 5 AnyLogic blog posts of 2023
Last year, we published 32 blog posts, each unique and filled with relevant information for the simulation community. In this post, we would like to share the top 5 pieces published in 2023 that resonated the most with readers.

Workshop on AnyLogic 9: experience the technology
Explore in-browser modeling with AnyLogic 9 and engage in a hands-on pub simulation workshop. Study the core stages with expert guidance. Experience consistent performance and witness AnyLogic 9's status as a novelty in high-capacity simulation modeling. Preview the beta version with an AnyLogic Cloud subscription, seizing a glimpse of the future before its official release.

AnyLogic 2023 in review
As 2023 comes to an end, it's time for us to reflect on the year that was. In this blog post, we have gathered everything that happened this year, from AnyLogic and AnyLogic Cloud releases to the much-anticipated face-to-face AnyLogic Conference 2023. We also discuss blog posts and case studies that you might find interesting. And of course, we haven't forgotten about our events, social media platforms, and newsletter.

Accelerate enterprise digital transformation with unmatched simulation tools
For enterprises, it’s crucial to have tools for forecasting as well as monitoring, analyzing, and optimizing their operations to maintain a competitive edge in the market. Enterprise Simulation is a web-based application that shows data on a set of digital twins and can be used at the operational level. Learn more about this application and the role the AnyLogic ecosystem plays in developing it.
10 Mar The Open Group Exploration & Mining Business Reference Model
The project has produced a standard with two parts, including an Exploration and Mining Business Reference Model (diagram) and a Business Capability Reference Map.
Role of interoperability in this project:
The EMMM standard defines a common reference model and consistent business capabilities that enable mining companies to describe their businesses in a consistent way. This project covers enterprise Architecture and consistent process descriptions and definitions for mining business capabilities. This project covers Enterprise Architecture and consistent process descriptions and definitions for mining business capabilities. It creates a consistent description of mining businesses for enterprise architectures in mining companies, and for business managers.
Many mining companies are using the EMMM standard to describe their businesses.
Stakeholders:
Enterprise architects, business managers, operations, IT
Status: The EMMM standard was published in 2013.
Accessibility Model: The Open Group is membership-based; however, the standard is made freely available for use. Learn more and access the model: https://www.opengroup.org/content/exploration-mining-metals-minerals-emmm-forum-0
Click through the PLOS taxonomy to find articles in your field.
For more information about PLOS Subject Areas, click here .
Loading metrics
Open Access
Peer-reviewed
Research Article
Modeling and Simulation of the Economics of Mining in the Bitcoin Market
* E-mail: [email protected]
Affiliation Department of Electric and Electronic Engineering, University of Cagliari, 09123 Cagliari, Italy
- Luisanna Cocco,
- Michele Marchesi
- Published: October 21, 2016
- https://doi.org/10.1371/journal.pone.0164603
- Reader Comments
In January 3, 2009, Satoshi Nakamoto gave rise to the “Bitcoin Blockchain”, creating the first block of the chain hashing on his computer’s central processing unit (CPU). Since then, the hash calculations to mine Bitcoin have been getting more and more complex, and consequently the mining hardware evolved to adapt to this increasing difficulty. Three generations of mining hardware have followed the CPU’s generation. They are GPU’s, FPGA’s and ASIC’s generations. This work presents an agent-based artificial market model of the Bitcoin mining process and of the Bitcoin transactions. The goal of this work is to model the economy of the mining process, starting from GPU’s generation, the first with economic significance. The model reproduces some “stylized facts” found in real-time price series and some core aspects of the mining business. In particular, the computational experiments performed can reproduce the unit root property, the fat tail phenomenon and the volatility clustering of Bitcoin price series. In addition, under proper assumptions, they can reproduce the generation of Bitcoins, the hashing capability, the power consumption, and the mining hardware and electrical energy expenditures of the Bitcoin network.
Citation: Cocco L, Marchesi M (2016) Modeling and Simulation of the Economics of Mining in the Bitcoin Market. PLoS ONE 11(10): e0164603. https://doi.org/10.1371/journal.pone.0164603
Editor: Nikolaos Georgantzis, University of Reading, UNITED KINGDOM
Received: February 22, 2016; Accepted: September 27, 2016; Published: October 21, 2016
Copyright: © 2016 Cocco, Marchesi. This is an open access article distributed under the terms of the Creative Commons Attribution License , which permits unrestricted use, distribution, and reproduction in any medium, provided the original author and source are credited.
Data Availability: All relevant data are within the paper and its Supporting Information files.
Funding: This work is supported by Regione Autonoma della Sardegna (RAS), Regional Law No. 7-2007, project CRP-17938 LEAN 2.0. The funding source has no involvement in any of the phases of the research.
Competing interests: The authors have declared that no competing interests exist.
Introduction
Bitcoin is a digital currency alternative to the legal currencies, as any other cryptocurrency. Nowadays, Bitcoin is the most popular cryptocurrency. It was created by a cryptologist known as “Satoshi Nakamoto”, whose real identity is still unknown [ 1 ]. Like other cryptocurrencies, Bitcoin uses cryptographic techniques and, thanks to an open source system, anyone is allowed to inspect and even modify the source code of the Bitcoin software.
The Bitcoin network is a peer-to-peer network that monitors and manages both the generation of new Bitcoins and the consistency verification of transactions in Bitcoins. This network is composed by a high number of computers connected to each other through the Internet. They perform complex cryptographic procedures which generate new Bitcoins (mining) and manage the Bitcoin transactions register, verifying their correctness and truthfulness.
Mining is the process which allows to find the so called “proof of work” that validates a set of transactions and adds them to the massive and transparent ledger of every past Bitcoin transaction known as the “Blockchain”. The generation of Bitcoins is the reward for the validation process of the transactions. The Blockchain was generated starting since January 3, 2009 by the inventor of the Bitcoin system himself, Satoshi Nakamoto. The first block is called “Genesis Block” and contains a single transaction, which generates 50 Bitcoins to the benefit of the creator of the block. The whole system is set up to yield just 21 million Bitcoins by 2040, and over time the process of mining will become less and less profitable. The main source of remuneration for the miners in the future will be the fees on transactions, and not the mining process itself.
In this work, we propose an agent-based artificial cryptocurrency market model with the aim to study and analyze the mining process and the Bitcoin market from September 1, 2010, the approximate date when miners started to buy mining hardware to mine Bitcoins, to September 30, 2015.
The model was validated studying its ability to reproduce some “stylized facts” found in real-time price series and some core aspects of the real mining business. In particular, the computational experiments performed can reproduce the unit root property, the fat tail phenomenon and the volatility clustering of Bitcoin price series. To our knowledge, this is the first model based on the heterogeneous agents approach that studies the generation of Bitcoins, the hashing capability, the power consumption, and the mining hardware and electrical energy expenditures of the Bitcoin network.
The paper is organized as follows. In Section Related Work we discuss other works related to this paper, in Section Mining Process we describe briefly the mining process and we give an overview of the mining hardware and of its evolution over time. In Section The Model we present the proposed model in detail. Section Simulation Results presents the values given to several parameters of the model and reports the results of the simulations, including statistical analysis of Bitcoin real prices and simulated Bitcoin price, and sensitivity analysis of the model to some key parameters. The conclusions of the paper are reported in the last Section. Finally, Appendices A, B, C, and D, in S1 Appendix , deal with the calibration to some parameters of the model, while Appendix E, in S1 Appendix , deals with the sensitivity of the model to some model parameters.
Related Work
The study and analysis of the cryptocurrency market is a relatively new field. In the latest years, several papers appeared on this topic, given its potential interest and the many issues related to it. Several papers focus on the de-anonymization of Bitcoin users by introducing clustering heuristics to form a user network (see for instance the works [ 3 – 5 ]); others focus on the promise, perils, risks and issues of digital currencies, [ 6 – 10 ]; others focus on the technical issues about protocols and security, [ 11 , 12 ]. However, very few works were made to model the cryptocurrencies market. Among these, we can cite the works by Luther [ 13 ], who studied why some cryptocurrencies failed to gain widespread acceptance using a simple agent model; by Bornholdt and Steppen [ 14 ], who proposed a model based on a Moran process to study the cryptocurrencies able to emerge; by Garcia et al. [ 15 ], who studied the role of social interactions in the creation of price bubbles; by Kristoufek [ 16 ] who analyzed the main drivers of the Bitcoin price; by Kaminsky and Gloor [ 17 ] who related the Bitcoin market to its sentiment analysis on social networks; and by Donier and Bouchaud [ 18 ] who showed how markets’ crashes are conditioned by market liquidity.
In this paper we propose a complex agent-based artificial cryptocurrency market model in order to reproduce the economy of the mining process, the Bitcoin transactions and the main stylized facts of the Bitcoin price series, following the well known agent-based approach. For reviews about agent-based modelling of the financial markets see the works [ 19 , 20 ] and [ 21 ].
The proposed model simulates the Bitcoin market, studying the impact on the market of three different trader types: Random traders, Chartists and Miners. Random traders trade randomly and are constrained only by their financial resources as in work [ 22 ]. They issue buy or sell orders with the same probability and represent people who are in the market for business or investing, but are not speculators. Our Random traders are not equivalent to the so called “noise traders”, who are irrational traders, able of affecting stock prices with their unpredictable changes in their sentiments (see work by Chiarella et al. [ 23 ] and by Verma et al. [ 24 ]). Chartists represent speculators. They usually issue buy orders when the price is increasing and sell orders when the price is decreasing. Miners are in the Bitcoin market aiming to generate wealth by gaining Bitcoins and are modeled with specific strategies for mining, trading, investing in, and divesting mining hardware. As in the work by Licalzi and Pellizzari [ 25 ]—in which the authors model a market where all traders are fundamentalists—the fat tails, one of the main “stylized facts” of the real financial markets, stem from the market microstructure rather than from sophisticated behavioral assumptions.
Note that in our model no trader uses rules to form expectations on prices or on gains, contrarily to the works by Chiarella et al. [ 23 ] and by Licalzi and Pellizzari [ 25 ], in which traders use rules to form expectations on stock returns. In addition, no trader imitates the expectations of the most successful traders as in the work by Tedeschi et al. [ 26 ].
The proposed model implements a mechanism for the formation of the Bitcoin price based on an order book. In particular, the definition of price follows the approach introduced by Raberto et al. [ 27 ], in which the limit prices have a random component, modelling the different perceptions of the Bitcoin value, whereas the formation of the price is based on the limit order book, similar to that presented by Raberto et al. [ 22 ]. As regards the limit order book, it is constituted by two queues of orders in each instant—sell orders and buy orders. At each simulation step, various new orders are inserted into the respective queues. As soon as a new order enters the book, the first buy order and the first sell order of the lists are inspected to verify if they match. If they match, a transaction occurs. This in contrast with the approach adopted by Chiarella et al. [ 23 ], Licalzi and Pellizzari [ 25 ] and by Tedeschi et al. [ 26 ], in which the agents decide whether to place a buy or a sell order, and choose the size of the order, maximizing their own expected utility function.
The proposed model is, to our knowledge, the first model that aims to study the Bitcoin market and in general a cryptocurrency market– as a whole, including the economics of mining. It was validated by performing several statistical analyses in order to study the stylized facts of Bitcoin price and returns, following the approaches used by Chiarella et al. [ 23 ], Cont [ 28 ], Licalzi and Pellizzari [ 25 ] and Radivojevic et al. [ 29 ], for studying the stylized facts of prices and returns in financial markets.
The Mining Process
Today, every few minutes thousands of people send and receive Bitcoins through the peer-to-peer electronic cash system created by Satoshi Nakamoto. All transactions are public and stored in a distributed database called Blockchain, which is used to confirm transactions and prevent the double-spending problem.
People who confirm transactions of Bitcoins and store them in the Blockchain are called “miners”. As soon as new transactions are notified to the network, miners check their validity and authenticity and collect them into a set of transactions called “block”. Then, they take the information contained in the block, which include a variable number called “nonce”, and run the SHA-256 hashing algorithm on this block, turning the initial information into a sequence of 256 bits, known as Hash [ 30 ].
There is no way of knowing how this sequence will look before calculating it, and the introduction of a minor change in the initial data causes a drastic change in the resulting Hash.
The miners cannot change the data containing the information on transactions, but can change the “nonce” number used to create a different hash. The goal is to find a Hash having a given number of leading zero bits. This number can be varied to change the difficulty of the problem. The first miner who creates a proper Hash with success (he finds the “proof-of-work”), gets a reward in Bitcoins, and the successful Hash is stored with the block of the validated transactions in the Blockchain.
In a nutshell,
“Bitcoin miners make money when they find a 32-bit value which, when hashed together with the data from other transactions with a standard hash function gives a hash with a certain number of 60 or more zeros. This is an extremely rare event”, [ 30 ].
The steps to run the network are as follows:
“New transactions are broadcast to all nodes; each node collects new transactions into a block; each node works on finding a difficult proof-of-work for its block; when a node finds a proof-of-work, it broadcasts the block to all nodes; nodes accept the block only if all transactions in it are valid and not already spent; nodes express their acceptance of the block by working on creating the next block in the chain, using the hash of the accepted block as the previous hash”, [ 1 ].
Producing a single hash is computationally very easy. Consequently, in order to regulate the generation of Bitcoins, the Bitcoin protocol makes this task more and more difficult over time.
The proof-of-work is implemented by incrementing the nonce in the block until a value is found that gives the block’s hash with the required leading zero bits. If the hash does not match the required format, a new nonce is generated and the Hash calculation starts again [ 1 ]. Countless attempts may be necessary before finding a nonce able to generate a correct Hash (the size of the nonce is only 32 bits, so in practice it is necessary to vary also other information inside the block to be able to get a hash with the required number of leading zeros, which at the time of writing is about 70).
The computational complexity of the process necessary to find the proof-of-work is adjusted over time in such a way that the number of blocks found each day is more or less constant (approximately 2016 blocks in two weeks, one every 10 minutes). In the beginning, each generated block corresponded to the creation of 50 Bitcoins, this number being halved each four years, after 210,000 blocks additions. So, the miners have a reward equal to 50 Bitcoins if the created blocks belong to the first 210,000 blocks of the Blockchain, 25 Bitcoins if the created blocks range from the 210,001st to the 420,000th block in the Blockchain, 12.5 Bitcoins if the created blocks range from the 420,001st to the 630,000th block in the Blockchain, and so on.
Over time, mining Bitcoin is getting more and more complex, due to the increasing number of miners, and the increasing power of their hardware. We have witnessed the succession of four generations of hardware, i.e. CPU’s, GPU’s, FPGA’s and ASIC’s generation, each of them characterized by a specific hash rate (measured in H/sec) and power consumption. With time, the power and the price of the mining hardware has been steadly increasing, though the price of H/sec has been decreasing. To face the increasing costs, miners are pooling together to share resources.
The evolution of the mining hardware
In January 3, 2009, Satoshi Nakamoto created the first block of the Blockchain, called “Genesis Block”, hashing on the central processing unit (CPU) of his computer. Like him, the early miners mined Bitcoin running the software on their personal computers. The CPU’s era represents the first phase of the mining process, the other eras being GPU’s, FPGA’s and ASIC’s eras (see web site https://tradeblock.com/blog/the-evolution-of-mining/ ).
Each era announces the use of a specific typology of mining hardware. In the second era, started about on September 2010, boards based on graphics processing units (GPU) running in parallel entered the market, giving rise to the GPU era.
Around December 2011, the FPGA’s era started, and hardware based on field programmable gate array cards (FPGA) specifically designed to mine Bitcoins was available in the market. Finally, in 2013 fully customized application-specific integrated circuit (ASIC) appeared, substantially increasing the hashing capability of the Bitcoin network and marking the beginning of the fourth era.
Over time, the different mining hardware available was characterized by an increasing hash rate, a decreasing power consumption per hash, and increasing costs. For example, NVIDIA Quadro NVS 3100M, 16 cores, belonging to the GPU generation, has a hash rate equal to 3.6 MH/s and a power consumption equal to 14 W [ 31 ]; ModMiner Quad, belonging to the FPGA generation, has a hash rate equal to 800 MH/s and a power consumption equal to 40 W [ 31 ]; Monarch(300), belonging to the ASIC generation, has a hash rate equal to 300 GH/s and a power consumption equal to 175 W (see web site https://tradeblock.com/mining/ .
Modelling the Mining Hardware Performances
The goal of our work is to model the economy of the mining process, so we neglected the first era, when Bitcoins had no monetary value, and miners used the power available on their PCs, at almost no cost. We simulated only the remaining three generations of mining hardware.
The average hash rate and the average power consumption were computed averaging the real market data at specific times and constructing two fitting curves.
To calculate the hash rate and the power consumption of the mining hardware of the GPU era, that we estimate ranging from September 1st, 2010 to September 29th, 2011, we computed an average for R and P taking into account some representative products in the market during that period, neglecting the costs of the motherboard.
In that era, motherboards with more than one Peripheral Component Interconnect Express (PCIe) slot started to enter the market, allowing to install multiple video cards in only one system, by using adapters, and to mine criptocurrency, thanks to the power of the GPUs. In Table 1 , we describe the features of some GPUs in the market in that period. The data reported are taken from the web site http://coinpolice.com/gpu/ .
- PPT PowerPoint slide
- PNG larger image
- TIFF original image
https://doi.org/10.1371/journal.pone.0164603.t001
As regards the FPGA and ASIC eras, starting around September 2011 and December 2013 respectively, we tracked the history of the mining hardware by following the introduction of Butterfly Labs company’s products into the market. We extracted the data illustrated in Table 2 from the history of the web site http://www.butterflylabs.com/ through the web site web.archive.org . For hardware in the market in 2014 and 2015 we referred to the Bitmain Technologies Ltd company, and in particular, to the mining hardware called AntMiner (see web site https://bitmaintech.com and Table 2 ).
FPGA Hardware from 09/29/2011 to 12/17/2012, ASIC Hardware from 12/17/2012 to December 2013 and AntMiner Hardware produced in 2014 and 2015.
https://doi.org/10.1371/journal.pone.0164603.t002
Starting from the mining products in each period (see Tables 1 and 2 ), we fitted a “best hash rate per $” and a “best power consumption function” (see Table 3 ). We call the fitting curves R ( t ) and P ( t ), respectively.
https://doi.org/10.1371/journal.pone.0164603.t003
Fig 1A and 1B show in logarithmic scale the fitting curves and how the hash rate increases over time, whereas power consumption decreases.
(A) Fitting curve of R(t). (B) fitting curve of P(t).
https://doi.org/10.1371/journal.pone.0164603.g001
We used blockchain.info , a web site which displays detailed information about all transactions and Bitcoin blocks—providing graphs and statistics on different data—for extracting the empirical data used in this work. In particular, we observed the time trend of the Bitcoin price in the market, the total number of Bitcoins, the total hash rate of the Bitcoin network and the total number of Bitcoin transactions.
The proposed model presents an agent-based artificial cryptocurrency market in which agents mine, buy or sell Bitcoins.
We modeled the Bitcoin market starting from September 1st, 2010, because one of our goals is to study the economy of the mining process. It was only around this date that miners started to buy mining hardware to mine Bitcoins, denoting a business interest in mining. Previously, they typically just used the power available on their personal computers.
- there are various kinds of agents active on the BTC market: Miners, Random traders and Chartists;
- the trading mechanism is based on a realistic order book that keeps sorted lists of buy and sell orders, and matches them allowing to fulfill compatible orders and to set the price;
- agents have typically limited financial resources, initially distributed following a power law;
- the number of agents engaged in trading at each moment is a fraction of the total number of agents;
- a number of new traders, endowed only with cash, enter the market; they represent people who decided to start trading or mining Bitcoins;
- Miners belong to mining pools. This means that at each time t they always have a positive probability to mine at least a fraction of Bitcoin. Indeed, since 2010 miners have been pooling together to share resources in order to avoid effort duplication to optimally mine Bitcoins. A consequence of this fact is that gains are smoothly distributed amongst Miners. On July 18th, 2010,
“ArtForz establishes an OpenGL GPU hash farm and generates his first Bitcoin block”
and on September 18th, 2010,
“Bitcoin Pooled Mining (operated by slush), a method by which several users work collectively to mine Bitcoins and share in the benefits, mines its first block”,
(news from the web site http://historyofBitcoin.org/ ).
Since then, the difficulty of the problem of mining increased exponentially, and nowadays it would be almost unthinkable to mine without participating in a pool.
In the next subsections we describe the model simulating the mining, the Bitcoin market and the related mechanism of Bitcoin price formation in detail.
Agents, or traders, are divided into three populations: Miners, Random traders and Chartists.
- r i , u ( t ) is the hashing capability of the hardware units u bought at time t by i – th miner;
- γ i ( t ) = 0 and γ 1, i ( t ) = 0 if no hardware is bought by i – th trader at time t . When a trader decides to buy new hardware, γ 1, i represents the percentage of the miner’s cash allocated to buy it. It is equal to a random variable characterized by a lognormal distribution with average 0.6 and standard deviation 0.15. γ i represents the percentage of the miner’s Bitcoins to be sold for buying the new hardware at time t . It is equal to 0.5* γ 1, i ( t ). The term γ 1, i ( t ) c i ( t ) + γ i ( t ) b i ( t ) p ( t ) expresses the amount of personal wealth that the miner wishes to allocate to buy new mining hardware, meaning that on average the miner will allocate 60% of her cash and 30% of her Bitcoins to this purpose. If γ i > 1 or γ 1, i > 1, they are set equal to one;
- ϵ is the fiat price per Watt and per hour. It is assumed equal to 1.4*10 −4 $, considering the cost of 1 KWh equal to 0.14$, which we assumed to be constant throughout the simulation. This electricity price is computed by making an average of the electricity prices in the countries in which the Bitcoin nodes distribution is higher; see web sites https://getaddr.bitnodes.io and http://en.wikipedia.org/wiki/Electricity_pricing .
Miners active in the simulation since the beginning will take their first decision within 60 days, at random times uniformly distributed. Miners entering the simulation at time t > 1 will immediately take this decision.
Note that, as already described in the section Mining Process , the parameter B decreases over time. At first, each generated block corresponds to the creation of 50 Bitcoins, but after four years, such number is halved. So, until November 27, 2012, 100,800 Bitcoins were mined in 14 days (7200 Bitcoins per day), and then 50,400 Bitcoins in 14 days (3600 per day).
Random Traders.
Random traders represent persons who enter the cryptocurrency market for various reasons, but not for speculative purposes. They issue orders for reasons linked to their needs, for instance they invest in Bitcoins to diversify their portfolio, or they disinvest to satisfy a need for cash. They issue orders in a random way, compatibly with their available resources. In particular, buy and sell orders are always issued with the same probability. The specifics of their behavior are described in section Buy and Sell Orders .
Note that a Chartist will issue an order only when the price variation is above a given threshold. So, in practice, the extent of Chartist activity varies over time.
All Random traders and Chartists entering the market at t = t E > 0, issue a buy order to acquire their initial Bitcoins. Over time, at time t > t E only a fraction of Random traders and Chartists is active, and hence enabled to issue orders. Active traders can issue only one order per time step, which can be a sell order or a buy order.
Orders already placed but not yet satisfied or withdrawn are accounted for when determining the amount of Bitcoins a trader can buy or sell. Details on the percentage of active traders, the number of the traders in the market and on the probability of each trader to belong to a specific traders’ population are described in Appendices B, C, and D, in S1 Appendix .
Buy and Sell Orders
- amount, expressed in $ for buy order and in Bitcoins for sell order: the latter amount is a real number, because Bitcoins can be bought and sold in fractions as small as a “Satoshi”;
- residual amount (Bitcoins or $): used when an order is only partially satisfied by previous transactions;
- limit price (see below), which in turn can be a real number;
- time when the order was issued;
- expiration time: if the order is not (fully) satisfied, it is removed from the book at this time.
The limit price models the price to which a trader desires to conclude their transaction. An order can also be issued with no limit (market order), meaning that its originator wishes to perform the trade at the best price she can find. In this case, the limit price is set to zero. The probability of placing a market order, P lim , is set at the beginning of the simulation and is equal to 1 for Miners, to 0.2 for Random traders and to 0.7 for Chartists. This is because, unlike Random traders, if Miners and Chartists issue orders, they wish to perform the trade at the best available price, the former because they need cash, the latter to be able to profit by following the price trend.
- p ( t ) is the current Bitcoin price;
The limit prices have a random component, modelling the different perception of Bitcoin value, that is the fact that what traders “feel” is the right price to buy or to sell is not constant, and may vary for each single order. In the case of buy orders, we stipulate that a trader wishing to buy must offer a price that is, on average, slightly higher than the market price.
The value of σ i is proportional to the “volatility” σ ( T i ) of the price p ( t ) through the equation σ i = Kσ ( T i ), where K is a constant and σ ( T i ) is the standard deviation of price absolute returns, calculated in the time window T i . σ i is constrained between a minimum value σ min and a maximum value σ max (this is an approach similar to that of [ 27 ]). For buy orders μ = 1.05, K = 2.5, σ min = 0.01 and σ max = 0.003.
An expiration time is associated to each order. For Random traders, the value of the expiration time is equal to the current time plus a number of days (time steps) drawn from a lognormal distribution with average and standard deviation equal to 3 and 1 days, respectively. In this way, most orders will expire within 4 days since they were posted. Chartists, who act in a more dynamic way to follow the market trend, post orders whose expiration time is at the end of the same trading day. Miners issue market orders, so the value of the expiration time is set to infinite.
Price Clearing Mechanism
We implemented the price clearing mechanism by using an Order Book similar to that presented in [ 22 ].
At every time step, the order book holds the list of all the orders received and still to be executed. Buy orders are sorted in descending order with respect to the limit price b i . Sell orders are sorted in ascending order with respect to the limit price s j . Orders with the same limit price are sorted in ascending order with respect to the order issue time.
At each simulation step, various new orders are inserted into the respective lists. As soon as a new order enters the book, the first buy order and the first sell order of the lists are inspected to verify if they match. If they match, a transaction occurs. The order with the smallest residual amount is fully executed, whereas the order with the largest amount is only partially executed, and remains at the head of the list, with its residual amount reduced by the amount of the matching order. Clearly, if both orders have the same residual amount, they are both fully executed.
After the transaction, the next pair of orders at the head of the lists are checked for matching. If they match, they are executed, and so on until they do not match anymore. Hence, before the book can accept new orders, all the matching orders are satisfied.
A sell order of index j matches a buy order of index i , and vice versa, only if s j ≤ b i , or if one of the two limit prices, or both, are equal to zero.
- if b i > 0, then p T = min ( b i , p ( t )),
- if s j > 0, then p T = max ( s j , p ( t )),
- when both orders have limit price equal to zero, p T = p ( t );
Simulation Results
The model described in the previous section was implemented in Smalltalk language. Before the simulation, it had to be calibrated in order to reproduce the real stylized facts and the mining process in the Bitcoin market in the period between September 1st, 2010 and September 30th, 2015. The simulation period was thus set to 1856 steps, a simulation step corresponding to one day. We included also weekends and holidays, because the Bitcoin market is, by its very nature, accessible and working every day.
Some parameter values are taken from the literature, others from empirical data, and others are guessed using common sense, and tested by verifying that the simulation outputs were plausible and consistent. We set the initial value of several key parameters of the model by using data recovered from the Blockchain Web site. The main assumption we made is to size the artificial market at about 1/100 of the real market, to be able to manage the computational load of the simulation. Table 4 shows the values of some parameters and their computation assumptions in detail. Other parameter values are described in the description of the model presented in the Section The Model . In Appendices A-D, in S1 Appendix , other details about the calibration of the model are shown. Specifically, the calibration of the trader wealth endowment, the number of active traders, the total number of traders in the market and the probability of a trader to belong to a specific traders’ population are described in detail.
https://doi.org/10.1371/journal.pone.0164603.t004
The model was run to study the main features of the Bitcoin market and of the traders who operate in it. In order to assess the robustness of our model and the validity of our statistical analysis, we repeated 100 simulations with the same initial conditions, but different seeds of the random number generator. The results of all simulations were consistent, as the following shows.
Bitcoin prices in the real and simulated market
We started studying the real Bitcoin price series between September 1st, 2010 and September 30, 2015, shown in Fig 2 . The figure shows an initial period in which the price trend is relatively constant, until about 950 th day. Then, a period of volatility follows between 950 th and 1150 th day, followed by a period of strong volatility, until the end of the considered interval. The Bitcoin price started to fall at the beginning of 2014, and continued on its downward slope until September 2015.
https://doi.org/10.1371/journal.pone.0164603.g002
As regards the prices in the simulated market, we report in Fig 3 the Bitcoin price in one typical simulation run. It is possible to observe that, as in the case of the real price, the price keeps its value constant at first, but then, after about 1000 simulation steps, contrary to what happens in reality, it grows and continues on its upward slope until the end of the simulation period.
https://doi.org/10.1371/journal.pone.0164603.g003
Fig 4A and 4B report the average and the standard deviation of the price in the simulated market, taken on all 100 simulations. Note that the average value of prices steadily increases with time, except for short periods, in contrast with what happens in reality. Fig 4B shows that the price variations in different simulation runs increase with time, as the number of traders, transactions and the total wealth in the market are increasing.
(A) Average Price and (B) standard deviation computed on the 100 Monte Carlo simulations performed.
https://doi.org/10.1371/journal.pone.0164603.g004
In the proposed model, the upward trend of the price depends on an intrinsic mechanism—the average price tends to the ratio of total available cash to total available Bitcoins. Since new traders bring in more cash than newly mined Bitcoins, the price tends to increase.
In reality, Bitcoin price is also heavily affected by exogenous factors. For instance, in the past the price strongly reacted to reports such as those regarding the Bitcoin ban in China, or the MtGox exchange going bust. Moreover, the total capitalization of the Bitcoin market is of the order of just some billion US$, so if a large hedge fund decided to invest in Bitcoins, or if large amounts of Bitcoins disappeared because of theft, fraud or mismanagement, the effect on price would potentially be very large. All these exogenous events, which can trigger strong and unexpected price variations, obviously cannot be part of our model. However, the validity of these agent-based market models is typically validated by their ability to reproduce the statistical properties of the price series, which is the subject of the next section.
Statistical analysis of Bitcoin prices in the real and simulated markets
Despite inability to reproduce the decreasing trend of the price, the model presented in the previous section is able to reproduce quite well all statistical properties of real Bitcoin prices and returns. The stylized facts, robustly replicated by the proposed model, are the same of a previous work of Cocco et al. [ 2 ].
It is well known that the price series encountered in financial markets typically exhibit some statistical features, also known as “stylized facts” [ 33 , 34 ]. Among these, the three uni-variate properties that appear to be the most important and pervasive of price series, are (i) the unit-root property, (ii) the fat tail phenomenon, and (iii) the Volatility Clustering . We examined daily Bitcoin prices in real and simulated markets, and found that also these prices exhibit these properties as discussed in detail in [ 2 ].
Regarding unit-root property, it amounts to being unable to reject the hypothesis that financial prices follow a random walk. To this purpose, we applied the Augmented Dickey-Fuller test, under the null hypothesis of random walk without drift, to the series of Bitcoin daily prices and to the series of Bitcoin daily price logarithms we considered. The corresponding critical values of the τ 1 statistic for the null hypothesis of random walk without drift at levels 1, 5, and 10% with 1856 observations are −2.58, −1.95 and −1.62 respectively. The τ 1 statistic is -1.2, and 0.5, respectively, for price series and price logarithm series. Consequently, at levels 1, 5, and 10% we cannot reject the null hypothesis.
The second property is the fat-tail phenomenon. Typically, in financial markets the distribution of returns at weekly, daily and higher frequencies displays a heavy tail with positive excess kurtosis.
The Kurtosis value of the real price returns is equal to 125.1 (see Table 5 ), consequently the distribution of returns is more outlier-prone than the normal distribution. The distribution of returns is a leptokurtic distribution, and so we can infer a “fat tail”.
https://doi.org/10.1371/journal.pone.0164603.t005
Fig 5 shows the decumulative distribution function of the absolute returns (DDF), that is the probability of having a chance in price larger than a given return threshold. This is the plot of one minus the cumulative distribution function of the absolute returns and highlights a “fat tail”.
https://doi.org/10.1371/journal.pone.0164603.g005
The index takes a value equal to 2.48, and is in accordance with those of real financial markets, where this index is normally below 4, as stated by Lux [ 37 ]. We also found that the right tail (due to positive changes in returns) of the distribution is fatter than the left tail (due to negative changes in returns). These indexes take values equal to 2.34 and 2.75, respectively. This is in contradiction with the situation in real financial markets, where the tail due to negative returns is fatter than the one due to positive returns [ 37 ].
The third property is Volatility Clustering : periods of quiescence and turbulence tend to cluster together. This can be verified by the presence of highly significant autocorrelation in absolute or squared returns, despite insignificant autocorrelation in raw returns.
Fig 6B and 6C show the autocorrelation functions of the real price returns and absolute returns, at time lags between zero and 20. It is possible to note that the autocorrelation of raw returns Fig 6B is often negative, and is anyway very close to zero, whereas the autocorrelation of absolute returns Fig 6C has values significantly higher than zero. This behavior is typical of financial price return series, and confirms the presence of volatility clustering.
Autocorrelation of (A) raw returns, and (B) absolute returns of Bitcoin prices.
https://doi.org/10.1371/journal.pone.0164603.g006
In conclusion, the Bitcoin price shows all the stylized facts of financial price series, as expected.
As regards the simulated market model, all statistical properties of real prices and returns are reproduced quite well in our model.
Statistics of price logarithm series are in brackets.
https://doi.org/10.1371/journal.pone.0164603.t006
In Table 7 , the 25th, 50th, 75th and 97.5th percentiles pertaining to average, standard deviation, skewness and kurtosis of the price returns across all Monte Carlo simulations are shown. The values of the mean of price returns and of absolute returns, as well as their standard deviations, compare well with the real values. The skewness of simulated prices tends to be lower than the real case but it is always positive. The simulated kurtosis is lower than the real case by more than one order of magnitude, but also for the simulated price returns we can infer a fat tail for their distribution.
https://doi.org/10.1371/journal.pone.0164603.t007
We computed the Hill tail index, and also the Hill index of the left and right tails of the absolute returns distribution. In Table 8 , the 25th, 50th, 75th and 97.5th percentiles pertaining to Hill tail indexes, across all Monte Carlo simulations, are shown.
https://doi.org/10.1371/journal.pone.0164603.t008
Also for the index of the simulated absolute returns distribution we found values around 4 and the right tail of the distribution is fatter than the left tail.
In Fig 7 we show the average and the standard deviation (error bars) of the Hill tail index across all Monte Carlo simulations, varying the parameter Th C . Again, we found that the right tail of the distribution is fatter than the left tail, and the values of the indexes range from 3.3 to 4.6. The average value of these indexes increases slightly when Chartists are in the market.
The vertical spreads depict the error bars (standard deviation) for the Hill exponent, which are evaluated across 100 runs of the simulations with different random seeds.
https://doi.org/10.1371/journal.pone.0164603.g007
Table 9 shows the 25th, 50th, 75th and 97.5th percentiles pertaining to average and standard deviation of the autocorrelation of raw returns, and those of absolute returns, at time lags between 1 and 20, across all Monte Carlo simulations, varying the parameter Th C . The values reported in Table 9 confirm that the autocorrelation of raw returns is lower than that of absolute returns and that there are not significant differences varying Th C from 0.01 to ∞. This confirms the presence of volatility clustering also for the simulated price series, irrespective of the presence of Chartists.
https://doi.org/10.1371/journal.pone.0164603.t009
Traders’ Statistics
Figs 8 – 10 show the average and the standard deviation of the crypto and fiat cash, and of the total wealth, A ( t ), of trader populations, averaged across all 100 simulations. These simulations were carried with Miners buying new hardware using an average percentage of 60% of their wealth, that looks to be reasonable (see Fig 12 and discussion thereof).
(A) Average and (B) standard deviation of Bitcoin held by all trader populations during the simulation period across all Monte Carlo simulations.
https://doi.org/10.1371/journal.pone.0164603.g008
(A) Average and (B) standard deviation of the cash held by all trader populations during the simulation period across all Monte Carlo simulations.
https://doi.org/10.1371/journal.pone.0164603.g009
(A) Average and (B) standard deviation of the total wealth of all trader populations during the simulation period across all Monte Carlo simulations.
https://doi.org/10.1371/journal.pone.0164603.g010
Fig 10A highlights how Miners represent the richest population of traders in the market, from about step 300 onwards. Note that the standard deviation of the total wealth is much more variable than shown in the former two figures. This is due to the fact that wealth is obtained by multiplying the number of Bitcoins by their price, which is very variable across the various simulations, as shown in Fig 4(B) .
Fig 11 , shows the average of the total wealth per capita of all trader populations, across all 100 Monte Carlo simulations. Miners are again the winners, from about the 700th simulation step onwards, thanks to their ability to mine new Bitcoins. Specifically, thanks to the percentage of cash that Miners allocate to buy new mining hardware, their average wealth per capita—that is about $1,000 at the beginning of the simulation—increases twelve fold to $12,000 at the end. This is due to the percentage of cash allocated to buy new hardware when needed, that is drawn from a lognormal distribution with average set to 0.6 and standard deviation set to 0.15, as already mentioned in the Section The Agents .
(A) Average across all Monte Carlo simulations of the total wealth per capita of all trader populations for γ 1 = 0.6. (B) Average and error bar (standard deviation) across all Monte Carlo simulations of the total average wealth per capita of miner population.
https://doi.org/10.1371/journal.pone.0164603.g011
To assess the stability of this result, we varied the average percentage of the wealth that Miners allocate for buying new hardware, γ 1 , to verify how varying this parameter can impact on Miners’ success. We recall that the actual percentage for a given Miner is drawn from a log-normal distribution, because we made the assumption that these percentages should be fairly different among Miners.
Fig 12 shows the average and the standard deviation (error bars) of the total wealth per capita for Miners, at the end of the simulation period, for increasing values of the average of γ 1 . It is apparent that Miners’ gains are inversely proportional to γ 1 , so the general strategy of devoting more money to buy hardware looks not successful for Miners. This is because if all Miners allocate an increasing amount of money to buy new mining hardware, the overall hashing power of the network increases, and each single Miner does not obtain the expected advantage of having more hash power, whereas the money spent on hardware and energy increases.
https://doi.org/10.1371/journal.pone.0164603.g012
On the other hand, the race among miners to buy more hardware—thus increasing their hashing power and the Bitcoins mined—is a distinct feature of the Bitcoin market. We stipulate that it is not reasonable that Miners allocate over 60% of their wealth every few months to buy hardware and pay electricity bills. Fig 12 shows that it is precisely the value γ 1 = 0.6 when Miners’ total wealth per capita at the end of the simulation stabilizes. We therefore used this value for our simulations.
We also studied the total wealth average per capita for all trader populations varing σ id , the standard deviation in the definition of the time when the Miners decide to buy or divest hardware units. Our analysis does not highlight significant difference varying σ id . Further results about the impact of these two parameters on the simulation results is presented in Appendix E , in S1 Appendix .
Having found that Miners’ wealth decreases when too much of it is used to buy new hardware, we studied if increasing the money spent in mining hardware would be a successful strategy for single Miners, when most other Miners do not follow it.
Scatterplots of (A) increase in wealth of single Miners versus their average wealth percentage used to buy mining hardware, and (B) total wealth of Miners versus their hashing power at the end of the simulation.
https://doi.org/10.1371/journal.pone.0164603.g013
Fig 14 shows the number of traders belonging to each population of traders, Chartists, Random traders and Miners. According to the definition of the probability of a trader to belong to a specific trader population, these numbers are the same across all 100 Monte Carlo simulations (see Appendix D , in S1 Appendix ).
These values are the same across all Monte Carlo simulations.
https://doi.org/10.1371/journal.pone.0164603.g014
Statistics Related to Hashing Power and Power Consumption
Fig 15A shows the average hashing capability of the whole network in the simulated market across all Monte Carlo simulations and the hashing capability in the real market. These quantities are both expressed in log scale. Note that the simulated hashing capability is multiplied by 100, that is the scaling factor of our simulations, which have 1/100 th of the real number of Bitcoin traders and miners.
(A) Comparison between real hashing capability and average of the simulated hashing capability across all Monte Carlo simulations (multiplied by 100) in log scale, and (B) average and standard deviation of the total expenses in electricity across all Monte Carlo simulations in log scale.
https://doi.org/10.1371/journal.pone.0164603.g015
The simulated hash rate does not follow the upward trend of the Bitcoin price at about the 1200th time step that is due to exogenous causes (the steep price increase at the end of 2013), that is obviously not present in our simulations. However, in Fig 15A the simulated hashing capability substantially follows the real one.
Fig 16A shows the average and standard deviation of the power consumption across all Monte Carlo simulations. Fig 16B shows an estimated minimum and maximum power consumption of the Bitcoin mining network, together with the average of the power consumption of Fig 16(a) , in logarithmic scale. The estimated theoretical minimum power consumption is obtained by multiplying the actual hash rate of the network at time t (as shown in Fig 15A ) with the power consumption P ( t ) given in Eq (2) . This would mean that the entire hashing capability of Miners is obtained using the most recent hardware. The estimated theoretical maximum power consumption is obtained by multiplying the actual hash rate of the network with the power consumption P ( t − 360), referring to one year before. This would mean that the entire hashing capability of Miners is obtained with one year old hardware, and thus less efficient. The estimated obsolescence of mining hardware is between six months and one year, so the period of one year should give a reliable maximum value for power consumption.
(A) Average and standard deviation of the power consumption across all Monte Carlo simulations. (B) Estimated minimum and maximum power consumption of the real Bitcoin Mining Network (solid lines), and average of the power consumption across all Monte Carlo simulations, multiplied by 100, the scaling factor of our simulations (dashed line). For the meaning of the diamond and circle, see text.
https://doi.org/10.1371/journal.pone.0164603.g016
The simulation results, averaged on 100 simulations, show a much more regular trend, steadily increasing with time—which is natural due to the absence of external perturbations on the model. However, the power consumption value is of the same order of magnitude as the “real” case. Also in this case the simulated consumption shown in Fig 16B is multiplied by 100, that is the scaling factor of our simulations.
Fig 16B also shows a diamond, at time step corresponding to April 2013, with a value of 38.8 MW. This value has been taken by Courtois et al, who write in work [ 30 ]:
In April 2013 it was estimated that Bitcoin miners already used about 982 Megawatt hours every day. At that time the hash rate was about 60 Tera Hash/s. (Refer to article by Gimein Mark “Virtual Bitcoin Mining Is a Real-World Environmental Disaster”, 13 April 2013 published on web site www.Bloomberg.com ).
In fact, the hash rate quoted is correct, but the consumption value looks overestimated of one order of magnitude, even with respect to our maximum power consumption limit. We believe this is due to the fact that the authors still referred to FPGA consumption rates, not fully appreciating how quickly the ASIC adoption had spread among the miners.
As of 2015, the combined electricity consumption was estimated equal to 1.46 Tera Wh per year, which corresponds to about 167 MW (see article “The magic of mining”, published on web site www.economist.com on 13 January 2015). This value is reported in Fig 16B as a circle. This time, the value is slightly underestimated, being on the lower edge of the power consumption estimate, and is practically coincident with the average value of our simulations.
Fig 17 show an estimate of the total expenses incurred every six days in electricity Fig 17A and in hardware Fig 17B for the new hardware bought each day in the real and simulated market. Note that also in this case the values of the simulated expenses are averaged across all Monte Carlo simulations.
(A) Real expenses and average expenses in electricity across all Monte Carlo simulations. (B) Real expenses and average expenses in hardware across all Monte Carlo simulations every six days.
https://doi.org/10.1371/journal.pone.0164603.g017
These expenses are the expenses incurred in six days by Miners, hence they are obtained by summing the daily expenses related to the new hardware bought. We assumed that the new hardware bought each day in the real (simulated) market is equal to the difference between the real (simulated) hash rate in t and the real (simulated) hash rate in t − 1. In other words, we assumed that the new hardware bought each day is the additional hashing capability acquired each day.
For both these expenses, contrary to what happens to the respective real quantities, the simulated quantities do not follow the upward trend of the price, due to the constant investment rate in mining hardware.
Fig 18A and 18B show the average and standard deviation, across all Monte simulations, of the expenses incurred every six days in electricity and in new hardware respectively, showing the level of the variation across the simulations.
Average and standard deviation of the expenses in electricity (A) and of the expenses in new hardware (B) across all Monte simulations.
https://doi.org/10.1371/journal.pone.0164603.g018
Remembering that our model sizes the artificial market at about 1/100 of the real market and that the number of traders, their cash and their trading probabilities are rough estimates of the real ones, the simulated market outputs can be considered reasonably close to the real ones.
Conclusions
In this work, we propose a heterogeneous agent model of the Bitcoin market with the aim to study and analyze the mining process and the Bitcoin market starting from September 1st, 2010, the approximate date when miners started to buy mining hardware to mine Bitcoins, for five years.
The proposed model simulates the mining process and the Bitcoin transactions, by implementing a mechanism for the formation of the Bitcoin price, and specific behaviors for each typology of trader. It includes different trading strategies, an initial distribution of wealth following Pareto’s law, a realistic trading and price clearing mechanism based on an order book, the increase with time of the total number of Bitcoins due to mining, and the arrival of new traders interested in Bitcoins.
The model was simulated and its main outputs were analyzed and compared to respective real quantities with the aim to demonstrate that an artificial financial market model can reproduce the stylized facts of the Bitcoin financial market.
The main result of the model is the fact that some key stylized facts of Bitcoin real price series and of Bitcoin market are very well reproduced. Specifically, the model reproduces quite well the unit-root property of the price series, the fat tail phenomenon, the volatility clustering of the price returns, the generation of Bitcoins, the hashing capability, the power consumption, and the hardware and electricity expenses incurred by Miners.
The proposed model is fairly complex. It is intrinsically stochastic and of course it includes endogenous mechanisms affecting the market dynamics. We performed some analysis of the sensitivity of the model to some key parameters, finding that the “herding” effect of Chartists, when a price trend is established, does not play a key role in the distribution of the price returns, and hence in the reproduction of the fat tail phenomenon that stem from the market microstructure rather than from sophisticated behavioral assumptions, as in the work by Licalzi et al. [ 25 ]; the Chartist behavior does not even affect other stylized facts, like the volatility clustering and unit-root property; the total wealth per capita for Miners varies with the average percentage value of their wealth allocated for buying new hardware, keeping substantially unchanged both their average hashing capability, and their average expenses in electricity, computed across all Monte Carlo simulations; finally, the heterogeneity in the fiat and crypto cash of the traders emerges endogenously also when traders start from the same initial wealth.
Future research will be devoted to studying the mechanisms affecting the model dynamics in deeper detail. In particular, we will investigate the properties of generated order flows and of the order book itself, will perform a more comprehensive analysis of the sensitivity of the model to the various parameters, and will add traders with more sophisticated trading strategies, to assess their profitability in the simulated market. In addition, since the calibration of our model is based on very few specific real data, and on many assumptions aiming to derive the needed data from indirect real data, we plan to perform a deeper analysis of the Blockchain, and to gather financial data from existing exchanges, in order to extract specific information needed for a better calibration of our model.
Supporting Information
S1 appendix. our appendices a, b, c, d and e are in the file “s1_appendix.pdf”..
https://doi.org/10.1371/journal.pone.0164603.s001
S1 Data. The file “S1_Data.pdf” contains the value of real Bitcoin price from September 1st, 2010 to September 30th, 2015.
Note that data in the file “S1 Data.txt” is carriage return–separated.
https://doi.org/10.1371/journal.pone.0164603.s002
S2 Data. The file “S2_Data.pdf” contains the value of the hash rate in the real Bitcoin network from September 1st, 2010 to September 30th, 2015.
Note that data in the file “S2 Data.txt” is carriage return–separated.
https://doi.org/10.1371/journal.pone.0164603.s003
S3 Data. The file “S3_Data.pdf” contains the value of the transaction number in the real Bitcoin network from September 1st, 2010 to September 30th, 2015.
Note that data in the file “S3 Data.txt” is carriage return–separated.
https://doi.org/10.1371/journal.pone.0164603.s004
S4 Data. The file “S4_Data.pdf” contains the value of simulated Bitcoin price from September 1st, 2010 to September 30th, 2015.
Note that data in the file “S4 Data.txt” is carriage return–separated.
https://doi.org/10.1371/journal.pone.0164603.s005
S5 Data. The file “S5_Data.pdf” contains data about traders.
Exactly data stored in this file is the following.
- crypto cash of the Random traders,
- fiat cash of the Random traders,
- crypto cash of the Chartists,
- fiat cash of the Chartists,
- crypto cash of Miners,
- fiat cash of Miners,
- average of the total hashing capability in the network across all traders,
- average of the total energy consumption in the network across all traders,
- total hashing capability in the network,
- total energy consumption in the network,
- average of the bitcoin mined in the network across all miners.
- to each variable corresponds a row of data separated by Tab characters, that are the values of the variable at each simulation step.
- each row of data, associated to a given variable, ends in a carriage return.
https://doi.org/10.1371/journal.pone.0164603.s006
S6 Data. The file “S6_Data.pdf” contains the number of Chartists in the simulated market from September 1st, 2010 to September 30th, 2015 for all Monte Carlo simulations.
Note that data in the file “S6 Data.txt” is carriage return–separated.
https://doi.org/10.1371/journal.pone.0164603.s007
S7 Data. The file “S7_Data.pdf” contains the number of Miners in the simulated market from September 1st, 2010 to September 30th, 2015 for all Monte Carlo simulations.
Note that data in the file “S7 Data.txt” is carriage return–separated.
https://doi.org/10.1371/journal.pone.0164603.s008
S8 Data. The file “S8_Data.pdf” contains the number of Random traders in the simulated market from September 1st, 2010 to September 30th, 2015 for all Monte Carlo simulations.
Note that data in the file “S8 Data.txt” is carriage return–separated.
https://doi.org/10.1371/journal.pone.0164603.s009
Author Contributions
- Conceived and designed the experiments: LC MM.
- Performed the experiments: LC MM.
- Analyzed the data: LC MM.
- Contributed reagents/materials/analysis tools: LC MM.
- Wrote the paper: LC MM.
- 1. Nakamoto S. Bitcoin: A Peer-to-Peer Electronic Cash System. www.Bitcoin.org 2009.
- 2. Cocco L, Concas G, Marchesi M. Using an Artificial Financial Market for studying a Cryptocurrency Market. Journal of Economic Interaction and Coordination, Springer. 2015; https://doi.org/10.1007/s11403-015-0168-2
- 3. Androulaki E, Karame G, Roeschlin M, Scherer T, Capkun S. Evaluating User Privacy in Bitcoin. Proceedings of the Financial Cryptography and Data Security Conference (FC). 2013.
- View Article
- Google Scholar
- 6. Brezo F, Bringas P. G. Issues and Risks Associated with Cryptocurrencies such as Bitcoin. The Second International Conference on Social Eco-Informatics. 2012.
- 7. Eyal I, Sirer E. Majority is not Enough: Bitcoin Mining is Vulnerable. CoRR. 2013; 1311.0243.
- 8. Hanley B.P. The False Premises and Promises of Bitcoin. CoRR. 2013; 1312.2048.
- 11. Bergstra J. A, Leeuw dK. Questions related to Bitcoin and other Informational Money. CoRR. 213; 1305.5956.
- 12. Singh P, Chandavarkar B. R, Arora S, Agrawal N. Performance Comparison of Executing Fast Transactions in Bitcoin Network Using Verifiable Code Execution. Second International Conference on Advanced Computing, Networking and Security. 2013.
- 13. Luther W. Cryptocurrencies, Network Effects, and Switching Costs. Mercatus Center Working Paper No. 13–17.2013.
- 14. Bornholdt S, Sneppen K. Do Bitcoins make the world go round? On the dynamics of competing crypto-currencies. CoRR. 2014; 1403.6378.
- 15. Garcia D, Tessone C.J, Mavrodiev P, Perony N. Feedback cycles between socio-economic signals in the Bitcoin economy The digital traces of bubbles: feedback cycles between socio-economic signals in the Bitcoin economy. CoRR. 2014; 1408.1494.
- PubMed/NCBI
- 17. Kaminsky J, Gloor P.A. Nowcasting the Bitcoin Market with Twitter Signals. CoRR. 2014; 1406.7577.
- 21. Iori G. Porter J. Agent based Modelling for Financial Markets. Chapter for Handbook on Computational Economics and Finance. Eds. Chen Shu-Heng and Kaboudan Mak, OUP Oxford University Pres. 2014. https://doi.org/10.1007/978-1-4614-5360-4_41
- 22. Raberto M, Cincotti S, Dose C, Focardi S, Marchesi M. Price formation in an artificial market: limit order book versus matching of supply and demand. Nonlinear Dynamics and Heterogenous Interacting Agents, Springer-Verlag. Berlin 2005. https://doi.org/10.1007/3-540-27296-8_20
- 30. Courtois N. T, Grajek M, NaikR. The Unreasonable Fundamental Incertitudes Behind Bitcoin Mining. CoRR. 2014; 1310.7935v3.
- 31. Courtois N. T. Crypto Currencies And Bitcoin. http://blog.bettercrypto.com/?page_id=20 2014.
Bridging the copper supply gap
Decarbonization is one of the greatest challenges of the 21st century. In 2015, governments around the world committed to binding targets, with the goal of limiting global warming to 2°C. Achieving this goal is heavily dependent on rapidly rolling out widespread electrification, which would help to replace hydrocarbons with renewable power sources. And innovation across commodities will play a critical role in helping mining companies respond to these challenges.
About the authors
This article is a collaborative effort by Scott Crooks, Jonathan Lindley, Dawid Lipus, Richard Sellschop , Eugéne Smit , and Stephan van Zyl, representing views from McKinsey’s Metals & Mining Practice.
One such commodity is copper, which is an essential ingredient for this process. In fact, electrification is projected to increase annual copper demand to 36.6 million metric tons by 2031. Although current supply projections based on restarts, certain or probable projects, and recycled production offer a pathway to 30.1 million metric tons, another 6.5 million metric tons of capacity (an additional 20 percent) remain to be found.
However, the adoption of new emergent technologies—including coarse particle recovery, sulfide leaching, and process optimization with machine learning—has the potential to close a significant portion of that gap (Exhibit 1). The obstacles to commercialization and widespread adoption are not trivial, and the numbers presented in this article are an estimate of full potential, not a forecast. But technological levers should be recognized alongside new mine development as part of the solution.
The trend of declining copper head grades is well established and unlikely to be reversed. Similarly, oxide ore bodies, which do not require concentrators and can be processed through less capital-intensive routes, are being exhausted. The mining industry has responded to these challenges by processing ever-increasing volumes of sulfide ores. In fact, over the past ten years, the volume of ore sent to concentrators has increased by 1.1 billion metric tons, representing 44 percent growth.
About the research
The analysis in this article was enabled by MineSpans, which is a proprietary McKinsey solution that provides mining operators and investors with robust cost curves, commodity supply and demand models, and detailed bottom-up models of individual mines.
For copper, MineSpans offers mine-level data on 390 primary copper mines and 170 secondary mines and tracks more than 300 active development projects.
Nevertheless, to supply via traditional methods the copper needed for the energy transition, miners will have to repeat this feat again, increasing the volume of ore processed by another 44 percent by 2031 (see sidebar, “About the research”). Of the 1.6 billion additional metric tons of ore required, 0.6 billion metric tons can be provided by recently announced mines or expansions. However, a gap of one billion tons per annum remains. There is an imperative to extract more metal from the ore being mined.
Developing and scaling new mineral-processing technologies
Three technological developments are gaining acceptance and scaling across the industry and can contribute meaningfully to bridging the supply gap: coarse particle recovery, sulfide leaching, and process optimization with machine learning.
Coarse particle recovery
Conventional sulfide flotation circuits are most effective at recovering metal-bearing particles from slurry when those particles are sized between 50 and 150 microns. 1 Equivalent to one one-thousandth of a millimeter. Above or below this range, recoveries fall away significantly, with the steepest rate of decline for coarse particle recovery (Exhibit 2).
The obstacles to commercialization and widespread adoption are not trivial, and the numbers presented in this article are an estimate of full potential, not a forecast. But technological levers should be recognized ... as part of the solution.
There are technologies aimed at expanding the acceptable particle size range for both fine and coarse particles. The most interesting recent developments have targeted the coarse fraction.
Recovering the metals in the coarse fraction has been an objective for flotation metallurgists since the first commercial application of flotation separation in the early 20th century. Most developments focused on improving control of the grinding process to ensure that more of the recoverable metal falls within the critical range. However, this approach is reaching its natural limits and frequently comes at the cost of reduced throughput or higher capital expenditures to build increasingly complex regrind systems.
Two lines of development offer the possibility of taking us beyond this dynamic: grind-circuit roughing and coarse particle scavenging.
Grind-circuit roughing, such as the CiDRA P29 system, 2 Can also be employed in a scavenger role at the end of the flotation circuit. addresses the challenge by recovering particles directly from the grind circuit. The system is based on the development of an innovative new material that acts as a so-called copper sponge, attracting and holding mineralized particles based on the same hydrophobic properties that cause them to float during flotation. Unlike systems that take effect further downstream, grind-circuit roughing offers the possibility of directly reducing the recirculating load in ball mills, increasing ball mill throughput by as much as 20 percent at a constant grind size.
Operators will need to decide how to take the dividend of increased ball mill efficiency, which could be seen as an opportunity either to drive throughput or to reduce grind size and increase recoveries at a constant throughput. The optimal choice will depend on the properties of the ore body and the existing configuration of the processing plant. However, even with allowances for further cleaning of the concentrate pulled by P29 and consideration of other common system bottlenecks, grind-circuit roughing could add 1.2 million to 4.6 million metric tons of annual copper production by 2032. In addition to these production gains, proportionately reducing energy consumption per metric ton of metal will likely have significant environmental benefits.
The additional copper production would also likely have a limited incremental environmental footprint and could represent significant economic value creation. If the potential production uplift is extended across all metals produced from sulfide ores using a similar production process, while valued at forecast market prices (minus additional processing costs), 3 Based on a copper price of $10,000 per metric ton and a range of forecasts across other sulfide-borne metals. an annual value pool of $20 billion to $85 billion emerges.
Coarse particle scavenging focuses on extending the range of particle sizes during flotation by adding equipment to the end of the circuit. One example is Eriez’s HydroFloat system, 4 Can also be employed in the role of grind-circuit roughing before material enters the flotation circuit. which combines the principles behind two conventional separation technologies: density separation and flotation. During conventional flotation, air bubbles are introduced into the ore slurry, at which point the bubbles attach to the mineral-bearing particles, lift them to the top of the tank, and create a metal-rich froth that can be skimmed off. However, the coarser the ore particles, the greater the chance they will shake off the air bubbles and sink back into the slurry before they can be skimmed off. HydroFloat addresses this problem by introducing layers within the cells that prevent the coarser particles from sinking, thereby improving their chances of recovery.
Regarding the impact of this technology, it was employed as a scavenger at the end of a processing plant, where it was possible to improve recovery by 2 to 6 percent, assuming a constant grind size and depending on site-specific factors. Applied across the industry, improved coarse particle flotation can result in an additional 0.5 million to 1.5 million metric tons of annual copper production by 2032. If applied across all metals found in sulfide deposits, the technology represents potential value creation of $9 billion to $26 billion per year.
The benefits of grind-circuit roughing and coarse particle flotation extend beyond their primary roles in augmenting operating concentrators to improve recoveries and throughput. First, the increased-tolerance coarse particles that those technologies create imply an opportunity to reduce water and energy consumption while still achieving the same production targets. Second, grind-circuit roughing and coarse particle flotation also open the possibility of reprocessing old tailings facilities and making other brownfield expansions for near-end-of-life mining operations economical, extending production at low capital and environmental cost and with reduced regulatory uncertainty. Finally, these technologies grant an opportunity to rethink greenfield mine design, reducing the grind-circuit requirements for same production and thereby offering savings across capital requirements and water and energy usage.
Sulfide leaching
Leaching-based technologies have traditionally been applied to oxide or secondary sulfide ore bodies. However, recent developments can help extend this processing pathway to primary-sulfide ore bodies.
Primary sulfides are typically processed at plants using flotation-based systems. Flotation is generally economical for ores with levels of copper that are greater than 0.25 percent, 5 As an average copper grade for a single commodity mine. Cutoff grades will often be lower, particularly if supported by significant by-product revenues. from which flotation can recover 85 to 90 percent. Ores lower than this grade are normally discarded as waste. Yet primary-sulfide leaching offers a pathway to recover copper from material that is currently below mill head grade and considered waste.
Several distinct technologies are opening up the primary-sulfide leaching space. Some have focused on chloride-based solutions, while others, such as Rio Tinto’s Nuton system, have focused on bioleaching. Technical results in trials at Kennecott and other sites are reportedly encouraging, but Nuton is also notable for innovation in the business model it has adopted. 6 Daniel Gleeson, “Rio Tinto’s Nuton ready to leverage its leaching R&D Legacy,” International Mining , October 14, 2022. Taking advantage of the environmental benefits and the lower capital requirement for mine development compared with conventional sulfide flotation, Rio Tinto entered into agreements with juniors such as McEwen Mining and Arizona Sonoran to use Nuton technology for greenfield mine development.
Beyond the developments within major mining houses, Jetti Resources, an independent service provider, is working with mine owners to use a catalyst-based system to leach primary sulfides at their sites. In December 2022, Jetti reported 23 active projects, working with a range of major mining houses. A $100 million series D financing round in October 2022 valued the company at $2.5 billion and attracted participation from major miners and manufacturing companies.
Practical limitations related to the construction and operation of heap leach pads may limit the application of this technology in the first instance to run-of-mine mineralized waste instead of tailings or existing mineralized waste stockpiles. There is still ground to cover to reach commercialization. However, if current barriers are overcome by the end of the decade, there could be an additional 2.4 million metric tons of refined-copper production per annum by 2032, with a lower water usage and tailings risk profile than is associated with current flotation-based production pathways. This could represent a $45 billion per annum opportunity across all sulfide-borne metals.
Process optimization with machine learning
One of the key challenges of mineral processing is that, to some extent, every ore body is variable. Day by day—and sometimes hour by hour—the characteristics of ores being fed into the processing plant will vary, responding to the process setup in different ways. Thus, maintaining the optimal plant configuration to recover the most metal while ensuring the required purity of concentrate produced remains a perpetual challenge.
Traditionally, adjusting the plant configuration was the province of plant metallurgists, who drew on a combination of academic study, professional experience, and knowledge of the specific ore body. As with any human-controlled process, human factors exert significant influence on outcomes, which sometimes resulted in not only excellence but also lost production due to suboptimal decision making.
The development of machine learning and its application to mineral-processing control over the past five years has added a level of rigor and consistency. 7 For more on this application, see Red Conger, Harry Robinson, and Richard Sellschop, “ Inside a mining company’s AI transformation ,” McKinsey, February 5, 2020. Best-in-class applications tend to retain the central role of an experienced plant operator, but they also provide prompts and data for the operator to act upon. Keeping a human in the loop ensures that decisions remain focused on the bigger picture and do not become purely algorithmic, while capturing the speed and consistency that machine learning and AI can provide.
By ensuring that processing plants are consistently working in the upper range of their capabilities, machine learning can add 2 to 4 percent to metal recoveries and 5 to 15 percent to throughput. Such improvements offer an increase in global production from existing and planned mines of half a million to one million metric tons of refined copper by 2032, creating $9 billion to $18 billion in value per annum across all sulfide concentrators.
The way forward
There are a number of actions stakeholders can take to capture the full potential of these opportunities.
Mine operators
For major mining companies, the new technologies mentioned, such as coarse particle recovery, sulfide leaching, and process optimization with machine learning, highlight the importance and potential contribution of internal innovation groups. Such roles can go far beyond incremental improvements—at their best, they stand alongside exploration and capital projects as drivers of future growth—and will likely be the key to taking these technologies from promising pilots to standard industry practice. Major miners can also continue to look for flexible, agile ways to work with juniors or service providers to ensure that they are drawing on the best ideas from across the industry.
In addition, these technologies reaffirm the importance of brownfield developments. The potential to maximize the benefits in this space—with a lower environmental footprint and continued livelihoods for local communities—remains attractive. As commodity prices increase and technology makes more possible, even sites that have fully ceased production can once more generate economic value.
To juniors, service providers, and research institutions, major mining companies are open for business, looking for partners, and creating opportunities. In this way, major companies can provide access to scale projects and support the growth of mining-tech unicorns.
These technologies also offer new options for greenfield projects. The “mine of the future” could require much lower ball mill capacity for the same output based on grind-circuit roughing technology, reducing capital requirements, water usage, and CO 2 emissions. Likewise, sulfide leaching offers the possibility of an incremental, low-capital-expenditure approach to the development of low-grade copper deposits that previously required the construction of capital-intensive concentrators. This approach can enable an incremental development model similar to that often used for gold deposits—particularly in high-risk areas, where the capital at risk and the payback period are critical investment criteria. Similarly, for local communities that would accept some mining but are not sure they want to commit to a megaproject, the option for an incremental mine development pathway could be attractive.
Metal buyers
For buyers of metals, the supply constraints facing the metals necessary for the energy transition can appear daunting, but new mineral-processing technologies are an indication that human ingenuity and the market economy tend to find a way to provide. However, this is not an invitation for passive optimism: buyers have a role in working with the supply chain by funding and promoting technological breakthroughs where they can. This requires careful analysis and staying abreast of industry trends.
As the world electrifies, the demand for copper will be difficult to meet. However, with innovative new mining and processing technologies, there is hope. Players from across the industry, from mine operators to developers to metal buyers, can make moves today to support the implementation of these new technologies and to innovate further. If they do, they could provide humanity with the key resources it needs for the future.
Scott Crooks is a consultant in McKinsey’s London office; Jonathan Lindley is a consultant in the Stamford office, where Richard Sellschop is a senior partner; Dawid Lipus is a consultant in the Wroclaw office; Eugéne Smit is a partner in the Denver office; and Stephan van Zyl is a partner in the Vancouver office.
Explore a career with us
Related articles.

The raw-materials challenge: How the metals and mining sector will be at the core of enabling the energy transition

Navigating a decade of challenges: Five winning initiatives for mining CEOs
- Cryptocurrency Projects
- Cryptocurrency Exchanges
- Cryptocurrency Miners
- Financial Institutions
- Family Offices
- Market Making
- OTC Trading
- Programmatic Execution
- Cryptocurrency Options
- Risk Management
- Market Updates
- Trading Commentary
- Crypto News
- Video Corner

Chart of the Week: Bitcoin Mining Part 3: The Bitcoin Mining Business Model
April 29, 2022
- facebook Share
- twitter Tweet
- linkedin Share
After covering the role of miners and the inputs they use to bring bitcoin to fruition in prior reports, we discuss the bitcoin mining business model, explore value drivers, and profile several public miners in the latest edition of our bitcoin mining-focused multi-part Chart of the Week.
The Bitcoin Mining Business Model
The bitcoin mining business model is a strong one, allowing for bitcoin mining companies to create bitcoin at structurally lower prices than the market and achieve high-profit margins when the price of bitcoin is high. Indeed, given economies of scale in procurement and operations, many top public miners have a marginal cost of production well below $10,000 per bitcoin, leading to ~80% gross profit margins for their self-mining businesses even after the recent dip in bitcoin price. Moreover, though less certain, there are opportunities for outsized growth, whether from individual miners taking hash rate market share or from bitcoin’s price outpacing the decrease in issuance from block reward halvings. These key attributes lead to what has and may continue to be a business model displaying strong profitability and growth.
Notwithstanding these positives, miners face a unique set of challenges. First, miners must deal with unpredictable inputs, where future mining profits are determined by volatile, unpredictable, and uncontrollable items like the future price of bitcoin, the future network hashrate, and the future price and speed/efficiency of rigs. Further, barriers to entry are low in normal times and bitcoin miners must increase their hashrate commensurate with that of the network or see their number of bitcoin mined drop. This in tandem with the industry’s high margins has led to a hashrate arms race despite an inability to know the “correct” strategy ex-ante. Lastly, given the nascency of the industry, bitcoin miners generally have inefficient capital structures funded mostly with equity. These challenges have led to an industry characterized by high earnings volatility, poor earnings visibility, and a high cost of capital resulting in low valuation multiples.
In the next few sections, we dig into the income statement and discuss the drivers of revenue, expenses, and profitability before diving into competitive strategies, profiling several top miners, and digging into the valuation.
Bitcoin Mining Revenues
Bitcoin miner revenues are determined mainly by the number of bitcoin mined and the price of bitcoin at the time of mining ( Revenue =number of bitcoin mined * price of BTC) . Further and as covered previously, a new block is produced roughly every ten minutes and the current block reward is 6.25 bitcoin, equating to nearly 330,000 bitcoin mined each year by the industry or 900 bitcoin per day. As miners join mining pools to smooth out production and the impact of luck, the expected number of bitcoin mined by any individual miner will be proportional to that miner’s hashrate market share. As such, we can further break out the number of bitcoin mined as a company’s hashrate market share applied to total industry bitcoin production. For example, a miner with a 4.0 EH/s total hashrate when the network hashrate is 200 EH/s will have a 2.0% hashrate market share and thus will garner 2.0% of the 900 bitcoin produced daily. This equates to 18 bitcoin each day, and should the price of bitcoin be $40,000 on that day, the miner would be expected to generate $720,000 of revenue. Note that in practice, miners may underperform this theoretical production calculation, either because rigs were offline or added late in the measurement period. Nevertheless, in more detail and including transaction fees, annual bitcoin mining revenue can be described as:
Revenue = (company hashrate/network hashrate) * 52,560 blocks/year * [6.25 block reward + tsx fees] * price of BTC
In addition to self-mining, many vertically integrated miners will offer hosting services, where they host and operate rigs owned by another party in exchange for a fee. Such fees typically incorporate minimum power usage and may be charged as a spread over the hosting provider’s direct power costs or contain a profit-sharing component. Hosting diversifies revenue, provides a source of fiat revenue helping miners HODL, and is steadier relative to self-mining, which may lower a miner’s cost of capital if it is a large enough part of their business. However, hosting is less profitable than self-mining in good times, and as such, many miners who provide hosting services constantly evaluate this tradeoff, more heavily weighting whichever business provides the highest expected return on capital at the time.
In addition to self-mining and hosting revenues, many miners may generate ancillary revenues, both operating and nonoperating, from various other sources. These include realized gains/losses on sales of digital assets, equipment sales, construction and engineering revenue, and interest earned on lending out their HODL, to name a few. We show the revenue breakout for five top publicly traded miners below. Note that Core Scientific’s other revenue comes from equipment sales, where the company leverages its relationship with leading manufacturers to secure equipment in advance and then sells the equipment to its customers.
Exhibit 1: Miner Revenue Composition, 2021
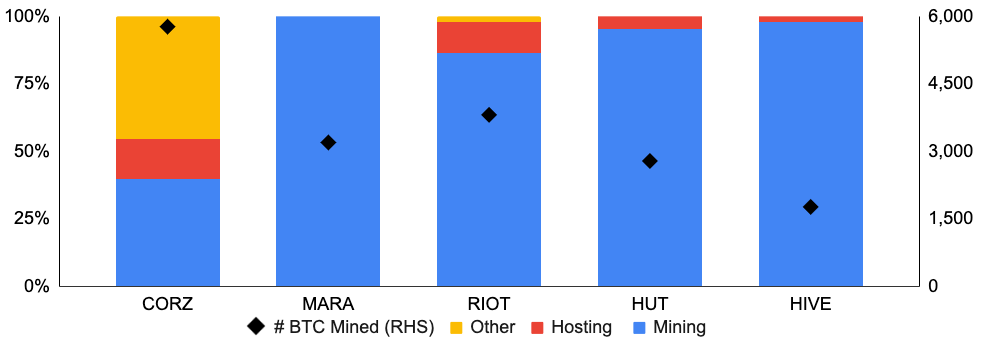
Source: Company websites, GSR
With self-mining (ie. mining for oneself, rather than as part of a hosting business) representing the vast majority of revenue for most miners, miners are under constant pressure to grow their hashrate market share and capture an ever-increasing number of the 900 bitcoin mined by the industry each day. This has led to an increasing network hashrate, especially after last year’s strong profitability and high availability of capital. In fact, most industry estimates place the Bitcoin network hashrate rising from ~220 EH/s currently to over 300 EH/s by year-end. BitOoda, for example, predicts a year-end 2022 network hashrate of 327 EH/s, with power infrastructure currently the gating factor to miner expansion, but semiconductor availability the limiter later in the year.
Such industry hashrate estimates tend to be fairly accurate over the near-term, as analysts can simply perform a bottoms-up analysis by looking at public company disclosed rig orders and estimate non-publicized orders and potential time delays, or perform a top-down analysis by estimating global chip production and the percentage going to crypto mining. Over a longer period of time where the price of bitcoin has more room to move higher or lower, however, such estimates may prove less accurate as the resulting profitability will have a large impact on the network hashrate. More specifically, strong profitability will attract greater investment in hashrate causing it to rise, while lower profitability will not only cause investment in hashrate to fall but also miners to turn off their unprofitable rigs. Note that the system has some balancing characteristics, where a falling bitcoin price isn’t as bad as it’d be in isolation for low-cost producers as some of the network hashrate moves offline (ie. a remaining miner will produce bitcoin at a lower price, but this is partially offset by the miner producing more bitcoin given the lower network hashrate). Conversely, a rising bitcoin price will undoubtedly attract additional hashrate and dampen the positive price impact for a specific miner if their hashrate market share fails to keep pace.
Exhibit 2 : BitOoda Network Hashrate Projection, EH/s, Log Scale
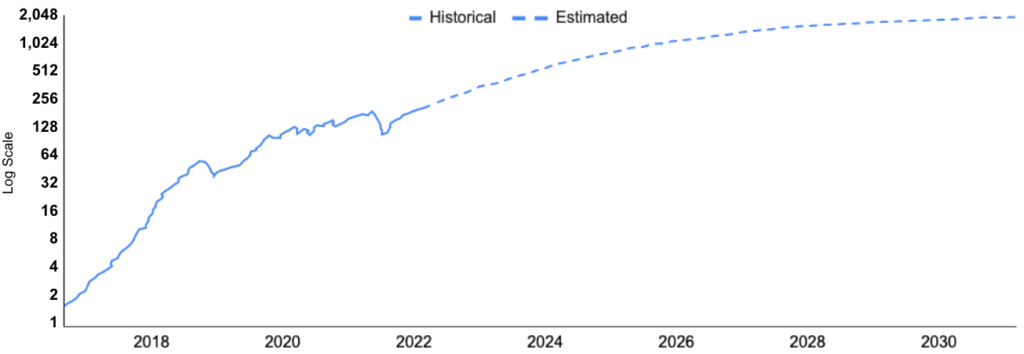
Source: BitOoda, GSR
With revenues proportional to hashrate market share and abundant capital after last year’s exceptional financial results, many of the largest miners are materially increasing efforts to expand. Marathon Digital, for example, is guiding for its 3.9 EH/s hashrate as of March to increase to 23.3 EH/s by early 2023. This should increase its network hashrate market share from 2.0% to ~7% using BitOoda’s year-end network hashrate estimate should the company achieve its guidance. Core Scientific and Riot Blockchain are also guiding to large increases in their self-mining hashrate, amounting to roughly two percentage point increases in each of their hashrate market shares, or an extra 18 bitcoin produced per day at year-end compared to March. As we’ll see later on, however, buying as many of the newest rigs at current prices may not produce the optimal outcome, and the current hashrate is more valuable than the future hashrate not yet in. Nevertheless, the five public miners highlighted below are guiding for their current cumulative 11.2% hashrate market share to nearly double by year-end.
Exhibit 3 : Year-End 2022 Guided Hashrate (EH/s) and Hashrate Market Share
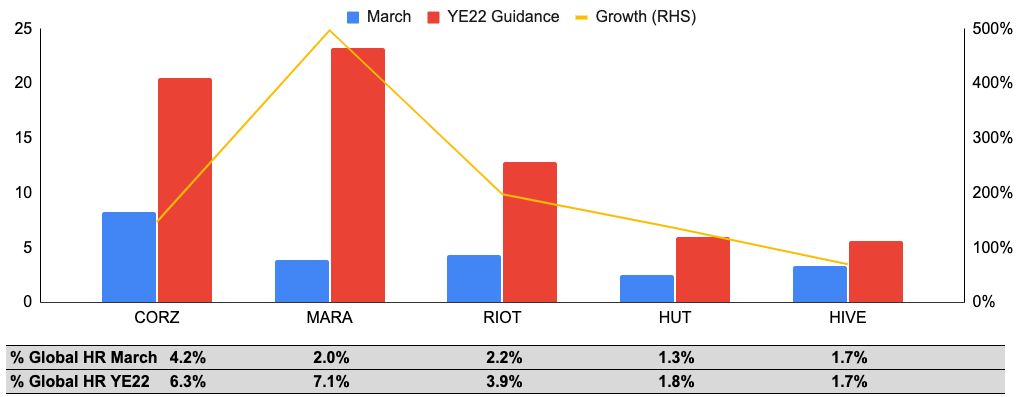
Source: Company websites, GSR Note: Hashrate denotes a miner’s hashrate used for self-mining and it excludes any hashrate that they may host for other miners. Hashrate numbers are shown in bitcoin-equivalent terms and may represent a mix of BTC/ETH hashrate. Current hashrate numbers are as of March 2022. Future hashrate targets are management guidance for year-end 2022, except for Marathon and Riot, which are guidance for Q1 2023 and Jan 2023, respectively. Uses BitOoda’s year-end 2022 network hashrate forecast of 327 EH/s published on April 4, 2022.
Bitcoin Mining Expenses
To generate revenue, miners combine power, rigs, and hosting sites, all of which come with their own costs. In more detail, major expenses for bitcoin mining companies include:
- Power: Power is the most important input into bitcoin mining as electricity costs comprise the vast majority of a miner’s marginal cost of production. In addition, inexpensive power allows for exceptional gross margins when the price of bitcoin is high (90%+ late last year) and for rigs to profitably remain online when the price of bitcoin falls. Miners who own their own facilities tend to enter into long-term power purchase agreements with grid operators and commit to purchasing a fixed amount of power over a long period of time, such as five or more years. Large miners with access to the cheapest power can procure electricity costs in the $0.02-0.03 per kWh range. To demonstrate just how inexpensive these prices are for the top miners, the average electricity price for households per kWh as of September 2021 was $0.34 in Germany, $0.28 in the UK, $0.24 in Japan, $0.16 in the US, $0.09 in China, and $0.08 in India. Alternatively, miners that use hosting services pay for electricity and hosting costs together, with Marathon’s $0.0426 per kWh blended cost across its entire fleet as an example.
- Rigs: Rigs are generally ordered in bulk, often at discounts up to 50% compared to what an individual would pay for a single rig. That said, rig prices can fluctuate greatly with the price of bitcoin, increasing 4x or more during bull runs. Rigs are an asset on the balance sheet and depreciated using the straight-line method over their expected useful lives. While new rigs may last for five to seven years given new technology and optimized operating environments, most miners generally depreciate their rigs over a shorter period out of conservatism. Riot and Hut 8, for example, depreciate their rigs over two years, while Marathon depreciates its rigs over five years. Note that older rigs often have lower depreciation expense, either because they are sometimes fully depreciated already or because they were purchased before bitcoin’s latest run when the rig price, and therefore amount of resulting depreciation, was much lower.
- Infrastructure: For those that own their own mining facilities, infrastructure is held at cost and depreciated using the straight-line method over the asset’s estimated useful life. Riot, for example, depreciates buildings and improvements over 10-25 years and machinery and facility equipment over 5-7 years, while Hut 8 depreciates its infrastructure assets over a 10-year useful life. Again, miners that outsource the deployment and hosting of machines to third-party hosting providers pay hosting fees rather than depreciate their infrastructure.
- General & Administrative: G&A expenses include salaries and stock-based compensation, marketing expense, professional fees, insurance, and other general expenses.
- Impairment: Most miners will review long-lived assets for impairment. One such asset is digital currencies, which are typically accounted for as intangible assets with indefinite useful lives recorded at cost less impairment. A miner will record an impairment expense when the carrying amount exceeds the fair value of the digital asset.
In practice, miner costs may be opaque, with disclosures, categorization, and accounting treatment sometimes varying between them and inhibiting comparisons between the miners. Nevertheless, most miners report a cost of revenue line item, which generally includes all the costs directly related to the production of bitcoin such as energy costs, hosting fees, electrical components, and operational staff salaries. Cost of revenues will also include costs directly related to producing non-mining revenues as well. Lastly, some miners also include depreciation and amortization in their cost of revenues while others do not, but all typically specify the amount of depreciation and amortization in their regulatory filings even when included in the cost of revenues.
We attempt to re-categorize expenses as consistently as possible and exclude non-operating/ non-recurring items such as digital asset and other impairment charges, fair value changes, and legal settlements to compare miner expense composition below. Cost of revenue, which again mainly includes the cost of power, facilities operating costs, and/or hosting fees, generally amounts to 30-50% of a miner’s total operating expenses. Depreciation and amortization expense, by contrast, tends to be much smaller, while other operating expenses such as compensation, rent, insurance, technology, professional fees, and marketing, generally amount to 20-45% of total expenses. Note that Core Scientific’s cost of revenues is relatively high as its cost of equipment sales runs through this line, while Marathon’s other operating expense is inflated in 2021 due to elevated stock-based compensation.
Exhibit 4: Operating Expense Composition, 2021
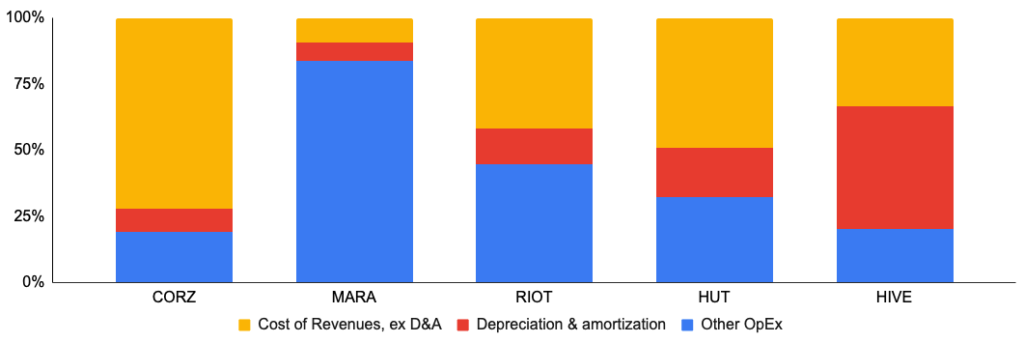
With cheap power the most important input, we show BitOoda’s estimated power and labor costs per kWh below. Hut 8 and HIVE tend to have more laddered and thus more costly fleets, though this also comes with a long history of operating experience that will help them through any future environment. We’d also note that deploying less efficient but profitable rigs may be dilutive to fleet efficiency and thus miner profitability, but is still accretive to earnings. Lastly, note that Riot’s low estimate is likely due to its Whinstone facility, which it is currently expanding to 700 megawatts of power and had a very low average self-mining net power cost of $0.027 / kWh in 2H21. While we’d classify all five miners shown below as having access to cheap power, this metric is a clear differentiator, increasing profitability during the good times and allowing miners to survive during the inevitable crypto winters.
Exhibit 5: BitOoda Estimated Power & Labor Costs, Cents per kWh
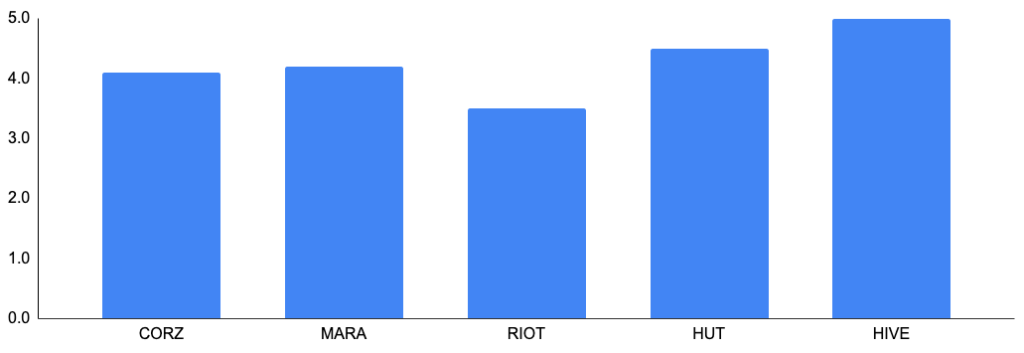
Several miners reference their cost of mining a single bitcoin in filings or company presentations. This can be thought of as both the breakeven cost of mining as well as an indication of profitability. For example, a miner with an $8,000 cost to mine one bitcoin when the price of bitcoin is at $40,000 will mine at an 80% gross mining margin. When analyzing cost per bitcoin, however, it’s important to understand the methodology used, as there can be differences in reporting between firms. Some miners like Marathon show a marginal cost of production that assumes hardware is already in place, so the incremental cost to mine bitcoin is only the cost per kWh of power and hosting. This amounted to a cost per bitcoin of $5,087 for Marathon in 4Q. Other miners like Hut 8 reference a cost to mine bitcoin based on the total cost of revenue excluding depreciation, so they are further incorporating expenses like personnel, network monitoring, equipment repair, and maintenance costs to form a more comprehensive cost of mining. This amounted to a cost per bitcoin of $21,912 for Hut 8 in 4Q. Below we show an estimated cost per bitcoin for the miners from The Block, which attempts to standardize the calculation between firms. Note that both company-stated cost per bitcoin and The Block’s estimates exclude depreciation as it is a non-cash expense and given varying accounting treatment, though the total cost to mine bitcoin inclusive of the investment in rigs is higher than what’s shown below.
Exhibit 6: The Block Estimated Costs to Mine One Bitcoin, $Thou
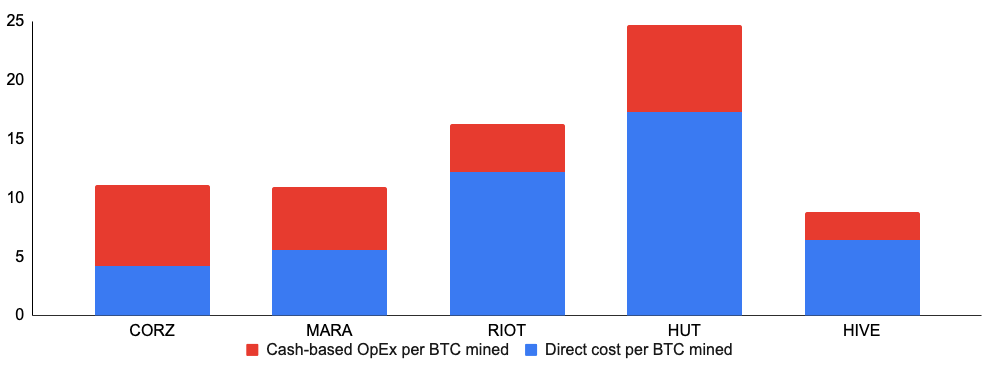
Source: The Block, GSR Note: Figures are for 9M21, except for HIVE, which is for 2021. HIVE mined 1,765 BTC and 41,965 ETH in 2021, and uses the average 0.055BTC/ETH for 2021 to calculate HIVE’s costs shown above.
Bitcoin Mining Profitability
Putting it all together, one can see that miner profitability is driven by optimizing revenues, determined mainly by hashrate market share and the price of bitcoin, and expenses, determined by a miner’s ability to procure inputs cheaply and operate efficiently.
Two key items outside of a miner’s control that will have an outsized impact on profitability are the network hashrate and the price of bitcoin. The two tend to move together, as a rising price of bitcoin attracts greater investment in hashrate and can make unprofitable, offline rigs profitable again, while a falling price of bitcoin can reduce investment and cause miners to power rigs down. However, the network hashrate and price do not always move together, as was the case in the second half of 2021 after China banned mining. Though rigs are portable, the process of moving them isn’t immediate and there was also a lack of sufficient infrastructure with cheap power in other jurisdictions to immediately accommodate all of China’s rigs. As such, the price of bitcoin recovered and reached new heights but the network hashrate only did so more slowly, allowing miners outside of China to benefit from high bitcoin prices as well as a low network hashrate.
To illustrate why the network hashrate and the price of bitcoin should be considered together, we provide the following example. A miner with 4 EH/s will garner a 2% hashrate market share when the network hashrate is at 200 EH/s, allowing them to produce 2% of the 900 bitcoins created by the industry each day, or 18 bitcoin. At a price of $40,000 per bitcoin, this amounts to $720,000 in daily revenue. If the price of bitcoin falls 10%, this would appear negative for the miner at first glance. However, if the price decline occurred alongside a 10% decline in the network hashrate, the miner is actually no worse off as long as they are still running. This is because a 10% decline in the 200 EH/s network hashrate results in a 180 EH/s network hashrate, and a 2.22% hashrate market share with the miner still at 4 EH/s. This would allow the miner to now produce 20 bitcoin each day rather than the original 18. Thus, after the 10% decline in the price of bitcoin to $36,000, daily revenues amount to $720,000, the same as before.
Exhibit 7: Bitcoin Price vs. Network Hashrate, Last Three Years
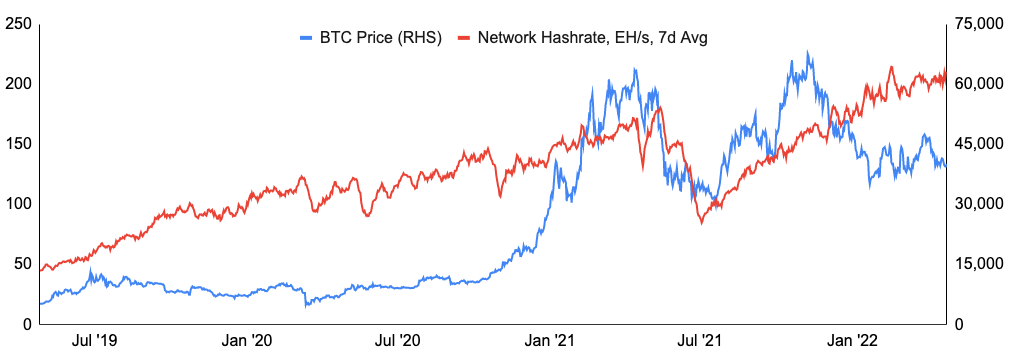
Source: Blockchain.com, Santiment, GSR
Another way to illustrate this is to look at the daily profitability of bitcoin mining, as measured in US dollars per day for 1 TH/s of hashrate. Over the last 12 months, the industry has made between $0.16 and $0.46 per day for each TH/s of hashrate. We show each day’s profitability below represented by the size of the bubble, with larger bubbles representing higher profitability. We then chart the daily profitability against the network hashrate and the price of bitcoin to show that the highest profits occur when the price of bitcoin is high and the network hashrate is low. Conversely, profitability falls materially when the price of bitcoin is low and the network hashrate is high.
Exhibit 8: Bitcoin Mining Daily Profitability (USD per day for 1 TH/s) vs. Bitcoin Price and Network Hashrate, LTM
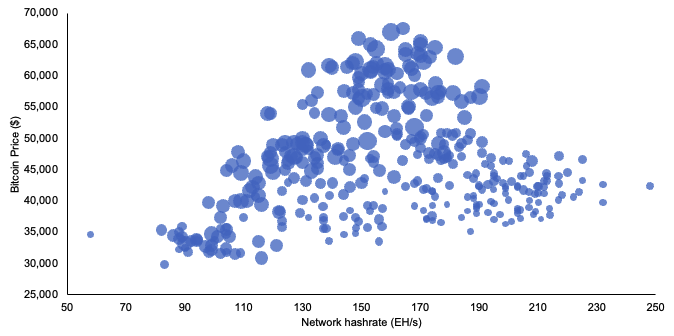
Source: Bitinfocharts.com, Blockchain.com, Santiment, GSR Note: Mining profitability is measured as the daily $ profit per 1 TH/s of hashrate and it is denoted relatively by the size of the bubbles.
At the company level, there are various profitability metrics such as the overall company gross margin, the self-mining business gross margin, and the adjusted EBITDA margin. Below we show the overall gross margin and the mining gross margin. Note that we use company-given margins where disclosed so the metrics may not be perfectly comparable. Nevertheless, in addition to efficiency, business mix plays a large part in determining the overall gross margin. Marathon, for example, reported a particularly strong gross margin in 2021 due in part to only having a self-mining business, which exhibited particularly strong returns last year. Core Scientific, by contrast, reported a much lower gross margin, which was heavily influenced by its large equipment sales and hosting businesses that tend to have lower profitability relative to 2021’s self-mining performance. Turning to the gross margin of the mining business, which removes the impact of business mix, we can see that HIVE had the strongest gross mining margin last year likely due at least in part to its large Ethereum mining operation, which was particularly profitable last year. Hut 8, by contrast, reported a lower gross margin for the mining business, likely due in part to its laddered fleet and what may be higher power costs that should improve as its new North Bay facility with a $0.027 CAD/kWh power cost ($0.021 USD / kWh) fills out.
Exhibit 9: Gross Margins – Total and Mining Operations, 2021
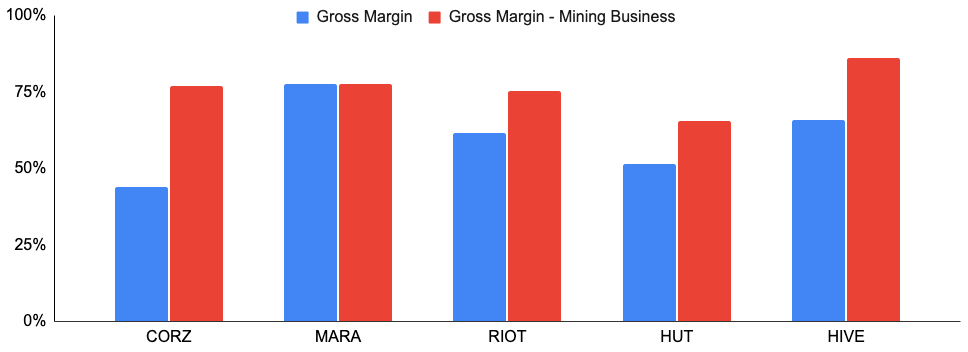
Source: Company websites, GSR Note: HIVE’s gross margin and HUT’s mining gross margin are estimated.
Competitive Strategies
Mining is a highly competitive business, with miners around the globe continuously hashing away day and night, 365 days a year. Miners compete on many fronts, including securing cheap power, acquiring ASICs, and raising capital. In addition, miners must decide whether to acquire assets directly or to leverage third-party service providers, where to locate, which rigs to utilize, and whether to sell or HODL mined bitcoin, among many other decisions. And, miners must make these decisions in light of many future unknowns, making the optimal decision difficult to discern ex-ante. In more detail major strategic decisions include:
- Hosting Infrastructure: As touched upon in the prior piece, miners may own the mining facilities they utilize, or they may purchase hosting services from a third-party hosting provider. Proponents of the former strategy argue that it reduces the expenses paid to third parties, secures future hosting needs, increases day-to-day operating control, creates long-term value given a longer infrastructure useful life, and enables the sale of hosting services with excess capacity. Proponents of the latter strategy, often referred to as an asset or capital-light strategy, believe that it’s more profitable to forgo investing in infrastructure in favor of acquiring more ASICs and maximizing hashrate sooner, especially in light of a rising network hashrate and the decreasing nature of block rewards. In addition, using hosting providers increases operational flexibility, allowing the miner to more easily change jurisdictions, move mining sites, or turn off power should regulations, power costs, or mining profitability change. Below we show a calculation from Marathon arguing that an asset-light model provides a greater return than owning both the rigs and the infrastructure. Note, however, that Riot provides a similar model in its investor presentation, but one which comes to the opposite conclusion and shows a vertically integrated approach is better. We believe that the conclusion is heavily influenced by the assumptions used, with some of the key differences between Marathon and Riot’s assumptions being the cost and useful life of electrical infrastructure, other infrastructure costs, and the assumed future price of bitcoin.
Exhibit 10: Marathon’s Asset Light Vs. Vertical Integration Return Projections
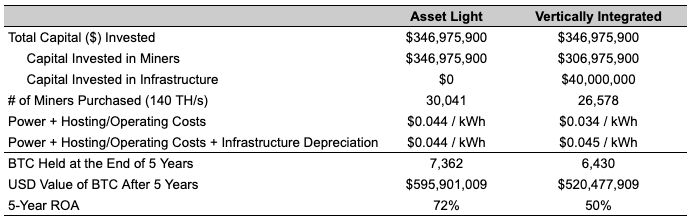
Source: Marathon Digital Investor Presentation, GSR
- Facility Location: Miners desire cheap, stable electrical power while minimizing regulatory and political risks. As such, miners prioritize geographies that offer cheap energy assets, a reliable power grid, and a stable regulatory environment with a strong rule of law. That said, some miners have facilities located in multiple countries, which can help diversify these risks. We include much more detail on the considerations behind facility selection in part two of this series.
Exhibit 11: Mining Facility Locations
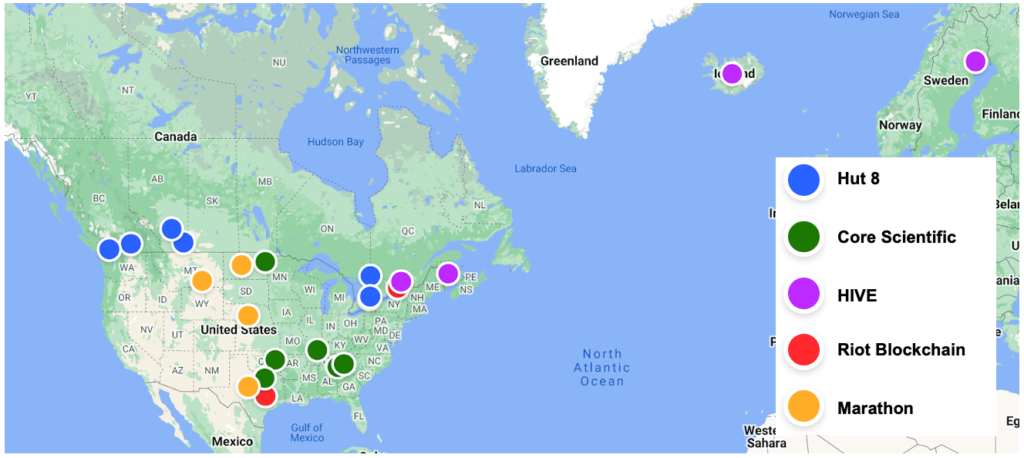
Source: Company websites, GSR Note: Core Scientific’s facility in Muskogee, OK is in progress and not yet operational. Core Scientific additionally has two facilities in Georgia and North Carolina, but only one is shown in each of these states on the map. Hut 8 facilities are a mix of mining facilities and traditional data center operations. The two facilities in Alberta, as well as the facility in North Bay, Ontario are their three crypto mining facilities, while the four remaining facilities are traditional data centers. Marathon leverages 3rd party hosting providers and they do not disclose the number of facilities they use or which cities they are in outside of the Hardin facility. Hence, we highlight the states in which Marathon deploys miners, but we’d note that this may not be an exhaustive list.
- Sell or HODL Production: Many early Bitcoin miners entered the space due to a strong fundamental belief in the asset and the underlying technology. This resulted in many miners holding on to their bitcoin production, aiming to benefit from the rising price of bitcoin. Historically, this hasn’t always been possible as miners had limited access to external funding and needed to pay monthly fiat-based costs. More recently, however, high profitability has led to greater access to capital for institutional miners, allowing them to finance day-to-day operations with externally-raised capital so they can HODL their bitcoin. These large institutional miners prefer to do so as they believe in the future of the asset, and it additionally attracts institutional investors looking to access bitcoin-like returns without having to worry about custody or the inefficiencies of futures-based ETFs. Recently, however, some miners who have been HODLing have sold a portion of their production.
- Financing: Miners have predominantly financed their operations through equity raises, and equity continues to make up the vast majority of their capital structure today. However, miners have increasingly used loans and debt instruments over the last six to nine months. The most prominent lenders, which often use miner-owned bitcoin and rigs as collateral, have been crypto-native companies, crypto-focused banks, and private credit funds, such as NYDIG, Genesis, Silvergate, and Galaxy Digital. Miners are also starting to issue hybrid debt, as exemplified by Marathon’s November 2021 $650m convertible note issuance. As the industry matures and debt financing becomes more accessible, miners will likely have an opportunity to employ more efficient financing.
- Mining Mix: Most large miners have prioritized bitcoin mining, but some also mine Ethereum and to a lesser extent, other tokens. Out of the five miners covered in this piece, only Hut 8 and HIVE have disclosed mining coins outside of bitcoin in any material size. Both Hut 8 and HIVE mine Ethereum at very attractive economics today, but this revenue stream will likely decrease as Ethereum transitions to proof-of-stake and both Hut 8 and HIVE switch to mining other GPU-mineable tokens. Currently, Ethereum mining makes up ~13% and ~39% of Hut 8 and HIVE’s bitcoin-equivalent hashrate, respectively. Hut 8 has contracted with its pool operator to receive ether mining rewards paid in bitcoin, so it is currently mining bitcoin indirectly through Ethereum at a cost of ~$2,000 per bitcoin, a level much cheaper than even the most cost-efficient bitcoin miners.
- Asset Management: Miners that maintain bitcoin on their balance sheet must decide how to manage it. Miners may simply maintain the assets in cold storage, lend them out to generate yield or use as collateral for a loan. In theory, miners may one day be able to generate enough yield on their HODL to cover operating expenses, never needing to sell production and only needing outside capital for growth.
- Hedging: While most commodity producers hedge at least some amount of future production, most public bitcoin miners choose not to do so for the same reasons they decide to HODL – to gain exposure to future bitcoin prices and to increase investor demand for their stock. As such, hedging has not been a large part of most public miners’ operations to date. Miners may also utilize electricity futures, though in practice most miners operate with long-term power agreements, making this less relevant than other hedging solutions. Lastly, there is an array of more exotic, Bitcoin-specific derivatives that may see increasing utilization as the industry matures. For example, BitOoda has historically executed hashrate futures, transaction fee swaps, and difficulty swaps on behalf of mining clients.
- ESG: Bitcoin miners have frequently been in the crosshairs of environmentalists, and mining operators need to determine how to position their business from an ESG perspective and have a strategy for addressing these concerns. Miners wishing to decrease their carbon footprint may prioritize renewable energy, purchase carbon offsets, or mining with flared gas, coal refuse, or some other medium that improves the health of the environment. This will be covered at length in our final part of this series.
Miner Profiles & Valuation
Core scientific (nasdaq: corz).
Based in Austin, TX, Core Scientific is the largest publicly traded, US-based crypto miner and hosting service provider. Founded in 2017, Core Scientific currently operates six data centers across North Carolina, Georgia, North Dakota, and Kentucky, with two additional data centers being developed in Texas and Oklahoma. Historically, the company predominantly generated revenue through third-party hosting services, but the company expanded its self-mining capabilities in July 2021 by acquiring Blockcap, one of its largest hosting customers. The company also generates a meaningful portion of revenue by securing ASICs and selling them to its hosting client base. Core Scientific was acquired in July 2021 by an energy-focused SPAC and began trading on the NASDAQ in January 2022 upon completion of the deal. Core Scientific is net carbon neutral, purchasing renewable energy credits to offset any carbon-emitting energy utilized.
Marathon Digital Holdings (NASDAQ: MARA)
Based in Las Vegas, NV, Marathon is the second-largest publicly traded Bitcoin miner in the US. Founded in 2010, the company historically operated a diverse set of businesses prior to entering the digital asset mining space in November 2017. Marathon employs a more nimble, capital-light strategy, predominantly leveraging third-party hosting infrastructure and deploying the freed-up capital into extra mining rigs. Marathon has miners deployed across South Dakota, Nebraska, Montana, and Texas, and primarily leverages Compute North facilities that tap off-grid renewable energy sources. Additionally, Marathon owns and operates Marapool, its own mining pool. Marathon aims to be 100% carbon neutral by year-end 2022.
Riot Blockchain (NASDAQ: RIOT)
Based in Castle Rock, CO, Riot is one of the largest publicly traded bitcoin miners and hosting service providers in the US. Riot began mining in 2018, and its fleet is deployed across its own facilities and third-party hosted facilities. In April 2021, Riot announced the acquisition of Whinstone US, the owner/operator of North America’s largest Bitcoin mining and hosting facility in Rockdale, TX. The facility featured 300 MW of developed capacity and Riot quickly embarked on an incremental 400 MW expansion plan. In addition, Riot recently announced plans for a massive 1 GW (1,000 MW) development in Navarro County, Texas with the first phase expected to commence mining and hosting operations in July 2023. Riot is the first miner to deploy an industrial scale liquid immersion mining operation, where chips are cooled via liquid immersion rather than traditional air cooling to generate extra hashrate.
Hut 8 Mining (TSE: HUT)
Based in Toronto, ON, Hut 8 is one of Canada’s largest publicly traded crypto miners and data center providers. The company began mining in 2017, and it operates three mining facilities across Alberta and Ontario. Further, Hut 8 is an authorized MicroBT repair shop, reducing rig downtime via on-site repairs, adding additional revenues, and strengthening its with the manufacturer. Hut 8 also utilizes its GPU fleet to mine Ethereum at very attractive economics. In January 2022, the company acquired TeraGo’s cloud and colocation data center business and it now operates five traditional data centers spanning the tier spectrum and supporting over 400 commercial customers in verticals such as gaming, media & entertainment, and government contracts. Hut 8 is aiming to be net carbon neutral by 2025.
HIVE Blockchain (CVE: HIVE)
Based in Vancouver, B.C., HIVE is one of Canada’s largest publicly traded crypto miners and hosting service providers. The company began mining Ethereum in 2017 as it acquired GPUs from a data center operator in Iceland. HIVE mines a diversified mix of bitcoin and Ethereum today, maintaining both exposures on its balance sheet. HIVE primarily deploys its machines at third-party hosted facilities spanning Quebec, Iceland, Sweden, and soon-to-be Texas, but HIVE did acquire one facility outright in New Brunswick. HIVE’s facilities are powered by clean hydroelectric and geothermal power.
Exhibit 12: Mining Company Background Information
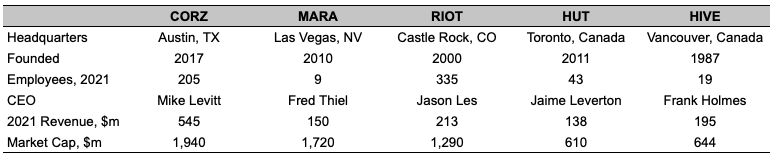
Source: Company websites, Yahoo Finance, GSR
Below we provide an overview of mining company operations. Hashrate is perhaps the most important controllable metric to monitor, and as such, many public miners will provide monthly updates as well as future hashrate guidance. It’s also useful to track the various inputs into hashrate, including both the current status of these inputs as well as progress on stated development. These include:
- Power: Power may be the most scarce asset in the industry and is a measure of developed capacity. Miners will also announce planned power for facilities in development, and it’s important to follow the progress of such facilities as an indication of the level and timing of future hashrate.
- Rigs: Rig orders and deliveries should be watched as rigs are ordered with large lead times and are often subject to delays. Rig characteristics should also be observed. For example, rig efficiency, which is measured in Joules / TH, allows miners to produce a higher hashrate with the same power footprint and impacts rig profitability. There has likely been less focus on efficiency given such strong margins, but should the price of bitcoin stall and profitability fall, efficiency will likely come to the fore.
Exhibit 13: Bitcoin Mining Company Operations Overview
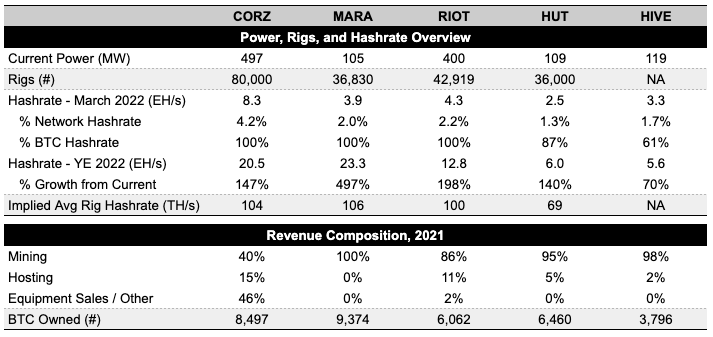
Source: Company websites, GSR Note: Power from company disclosed dated Dec ’21-Mar ’22, though differ on the exact point in time of the measurement. CORZ represents total company power, including for hosting. Rigs is for March for CORZ, MARA, and RIOT; HUT rigs are estimated based on numbers indicated in their 40-F filing as of Dec 21. H ashrate denotes a miner’s hashrate used for self-mining and it excludes any hashrate that they may host for other miners. Hashrate numbers are shown in bitcoin-equivalent terms and may represent a mix of BTC/ETH hashrate. Future hashrate targets for Marathon and Riot are estimates for Q1 2023 and Jan 2023, respectively, as opposed to December 2021 for the others. BTC owned for HIVE includes ETH HODL converted to BTC-equivalent.
Bitcoin Mining Stocks and Valuation
There are over 25 public bitcoin mining companies, with several more on the way and up significantly from a few years ago. This flurry of new listings has occurred as investor appetite for bitcoin exposure has increased and as mining companies seek access to capital via the public markets. Such capital has allowed public bitcoin miners to significantly expand hashrate market share from a mere 3% at the beginning of 2021 to 19% currently, per Arcane Research. And as we’ve shown above, public miners should continue to materially increase this percentage going forward.
As the price of bitcoin impacts miner earnings as well as the value of any digital assets on balance sheet, miner stocks have a high correlation with bitcoin, ranging from 0.60 to 0.75 recently. In fact, one simplistic view of the value of a bitcoin mining company’s stock is the present value of all future bitcoin mined plus any HODL (ignoring hosting and other businesses, which are small for most). Additionally, bitcoin mining stocks tend to be much more volatile than the stock market or even bitcoin itself. We believe mining stocks are more volatile than bitcoin for several reasons. First, revenues are directly impacted by the price of bitcoin, while expenses are much less and only indirectly so, causing an amplified impact on near-term earnings from changes in the price of bitcoin. In addition, the majority of value ascribed to a miner can be attributed to future bitcoin production, so any change in the current price of bitcoin will impact the present value of this. Lastly, we believe the level of volatility is also due to the nascency of the industry and high level of uncertainty.
Exhibit 14: Stock Price vs. Bitcoin Price, Last 12 Months, April 20, 2021 = 100
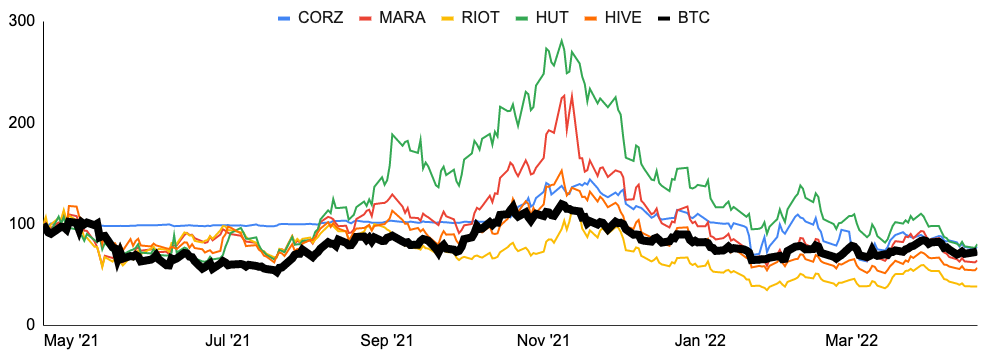
Source: Google Finance, Santiment, GSR Note: CORZ went public on January 20, 2022 via a SPAC deal with Power & Digital Infrastructure Acquisition Corp (NASDAQ: XPDI).
Investors in bitcoin mining stocks hold an inherent belief in the asset and are expressing a view that it is more profitable to invest in an entity that can extract and HODL bitcoin at a small fraction of its market price rather than hold bitcoin outright. However, high earnings volatility/ poor earnings visibility and future halvings are perhaps the biggest arguments against owning the stocks. Below we present the more frequent components to both the bull and bear theses for bitcoin mining stocks.
Exhibit 15: Bitcoin Mining Stocks Bull-Bear Theses
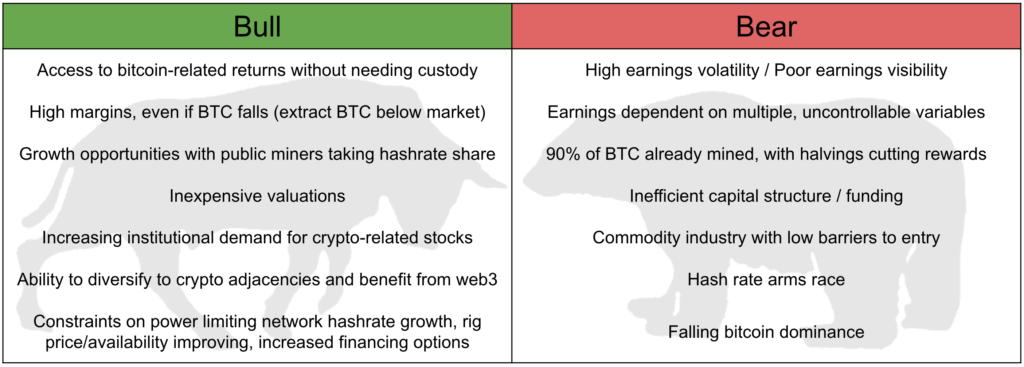
Source: GSR
When deciding on which bitcoin mining stocks to buy, analysts will often base their theses on a variety of items. These may include buying the stocks of miners that align with their views around strategy, business lines, mining exposures, revenue and expense opportunities, and ability to execute and meet or exceed guidance. For example, one may buy Core Scientific for a more diversified business in case the price of bitcoin falls, Marathon for its an asset-light strategy, Riot for the likely lowest power-cost producer, Hut 8 for exposure to blockchain/web3 growth or the opportunity to lower mining costs over time, or HIVE for exposure to Ethereum mining. All of these theses of course depend on performance relative to market expectations and valuation.
On that note, there is a very high level of dispersion in analyst estimates, making consensus estimates less reliable than more mature, well-covered industries, in our view. As such, we show a variety of mining company multiples using estimates from DA Davidson, which we trust and believe are modeled particularly well. As shown below, bitcoin mining stocks trade at a discount to the market and to fintech peers given high levels of uncertainty/volatility and the bear tenants described above. Additionally, multiples highlighted in red are expensive relative to mining peers while those highlighted in green are cheap on a relative basis. With Core Scientific and Marathon more expensive on most out-year multiples, it appears that the market may be paying up for growth, or perhaps for the cheaper names, expressing some level of skepticism in hitting their numbers.
Exhibit 16: Mining Company Valuation Multiples
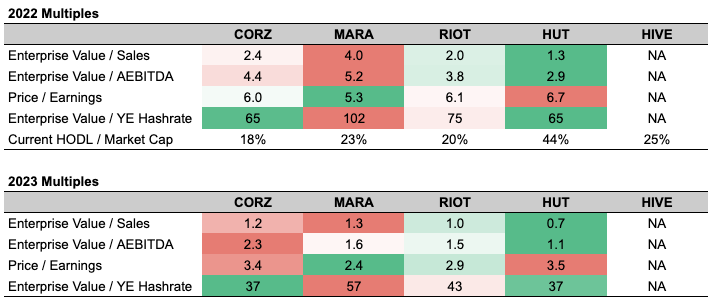
Source: DA Davidson, Yahoo Finance, Company websites, GSR Note: Multiples based on published estimates from DA Davidson as of April 28th, except for Current HODL / Market Cap, which represents the number of bitcoin and ether on balance sheet as of company March monthly updates valued at the current prices.
In the final part of this series, we’ll take a deeper dive into Bitcoin’s energy usage and impact on the environment .
Authors: Brian Rudick, Senior Strategist, Matt Kunke, Junior Strategist
View Full Report
Sources: The authors would like to thank Chris Brendler of DA Davidson, Sue Ennis of Hut 8, and Charlie Schumacher of Marathon Digital for helpful conversations on the miners.
Core Scientific Investor Relations, HIVE Blockchain, Hut 8, Marathon , Riot Blockchain, The Block Research: Breaking down Bitcoin mining’s cost of production, Galaxy Digital: How Much Does it Cost to Mine a Bitcoin?, Wolf of All Streets Podcast with Argo CEO Peter Wall, Anthony Pompliano: Bitcoin Mining For The World: Whit Gibbs : Full Interview, Compass Podcast: An Investor’s Guide To Mining | Brandon Bailey & Lili Rhodes, The Sazmining Podcast: CEO of Marathon discusses REAL NUANCES of Bitcoin with Fred Thiel, Paul Barron Network: Marathon Digital Holdings CEO Interview
This material is a product of the GSR Sales and Trading Department. It is not a product of a Research Department, not a research report, and not subject to all of the independence and disclosure standards applicable to research reports prepared pursuant to FINRA or CFTC research rules. This material is not independent of the Firm’s proprietary interests, which may conflict with your interests. The Firm trades instruments discussed in this material for its own account. The author may have consulted with the Firm’s traders and other personnel, who may have already traded based on the views expressed in this material, may trade contrary to the views expressed in this material, and may have positions in other instruments discussed herein. This material is intended only for institutional investors. Solely for purposes of the CFTC’s rules and to the extent this material discusses derivatives, this material is a solicitation for entering into a derivatives transaction and should not be considered to be a derivatives research report.
This material is provided solely for informational purposes, is intended for your use only and does not constitute an offer or commitment, a solicitation of an offer or comment (except as noted for CFTC purposes), or any advice or recommendation, to enter into or conclude any transaction (whether on the indicative terms shown or otherwise), or to provide investment services in any state or country where such an offer or solicitation or provision would be illegal.
Information is based on sources considered to be reliable, but not guaranteed to be accurate or complete. Any opinions or estimates expressed herein reflect a judgment made as of the date of publication, and are subject to change without notice. Trading and investing in digital assets involves significant risks including price volatility and illiquidity and may not be suitable for all investors. GSR will not be liable whatsoever for any direct or consequential loss arising from the use of this Information. Copyright of this Information belongs to GSR. Neither this Information nor any copy thereof may be taken or rented or redistributed, directly or indirectly, without prior written permission of GSR. Not a solicitation to U.S. Entities or individuals for securities in any form. If you are such an entity, you must close this page.
Subscribe to our Market Insights
By signing up you agree to the terms in our Privacy Policy
The following statement applies to any visitors to this website from the United Kingdom only: GSR Markets Ltd and GSR Markets Pte. Ltd are not authorised or regulated in the UK by the Financial Conduct Authority. The protections provided by the UK regulatory system will not be available to you. Please check any law that may apply to you in relation to the products and services offered. You acknowledge that you shall use the products and services at your own risk and will be responsible for any negative impact from applicable UK regulations.
- Get 7 Days Free
Investors Can Find More Than Gold in the Mining Industry
Moats are rare in the mining space—with one exception.

The mining industry has faced falling prices as supply chains have adjusted to interruptions from covid-19 and Russia’s invasion of Ukraine. Even so, prices remain generally elevated versus the 20-year average as well as relative to cost support.
After many years of generally focusing on returning excess cash to shareholders, elevated commodities prices are now encouraging the miners to once again tilt to growth through new developments, expansions, and mergers and acquisitions. This is particularly the case in energy transition commodities.
This industry searches for, develops, extracts, and processes commodities including iron ore, metallurgical coal, copper, and gold, and ships them to customers, often in an intermediate form, such as a concentrate.
In this space, gold tends to capture the bulk of investor attention, but it’s actually the second-largest market by value in the mining industry: The largest is iron ore.
Iron Ore Is the Mining Industry's Largest Market

Three key themes driving the mining industry are:
- Spot prices are generally falling—though they’re still elevated overall.
- Unit costs for major miners are rising.
- Miners are tilting toward growth.
In our 2024 Mined Commodities Landscape Report , we outline our expectations for the industry through the lens of these themes and share a few investing opportunities.
3 Key Themes for the Mining Industry
Our outlook for the mining industry is centered on three key themes:
- Spot prices are generally falling—though they remain elevated overall. Demand growth from China has been the main driver of rising commodities prices in the past two decades. More recently, though, most commodities prices have fallen from highs set with Russia’s invasion of Ukraine, the subsequent sanctions on Russia, and the rerouting of supply chains. Prices, nevertheless, are generally elevated versus the 20-year average, as well as relative to cost support.
- Unit costs for major miners are rising . Costs tend to loosely track commodities price changes, albeit with a lag. Unit costs have risen in recent years, driven by rising commodities prices and cost inflation. They generally fell around the mid-2010s in response to falling prices and weak China demand but rose again as China stimulated investment and commodities demand. Longer term, commodities prices should trade close to the marginal cost of production, which is generally around the 90th percentile of the industry cost curve.
- Miners are tilting toward growth. Mines are depleting assets, so reserves need constant replenishment, either via exploration or mergers and acquisitions. Spending on exploration and M&A tends to be correlated with commodities prices. After many years of focusing on returning excess cash to shareholders—with gold miners being the notable exception by instead focusing on significant M&A—elevated commodities prices are now encouraging miners to tilt toward growth, particularly in energy transition commodities.
Gold Likely to Benefit From Falling Interest Rates
Gold prices tend to be negatively correlated to real interest rates. The lack of cash flow from gold increases the opportunity cost to hold it as rates rise and vice versa, which means expectations of falling real interest rates are boosting gold prices.
Gold Prices Up on Expectations of Falling Interest Rates

While jewelry is the biggest source of demand, exchange-traded funds tend to be marginal buyers of gold, responding to movements in gold prices. Rising gold prices suggest ETF flows could turn positive, further supporting gold prices.
ETF Flows Could Turn Positive

One Mining Stock With a Wide Moat
Most of the mining companies on our coverage list have large market capitalizations, operate numerous mines, and are exposed to multiple commodities. Moats are rare, but with a Morningstar Economic Moat Rating of wide, Deterra Royalties is an exception.
Deterra Royalties DRR
- Primary Commodity: Iron Ore
- Morningstar Rating: 3 stars
- Morningstar Uncertainty Rating: Medium
- Fair Value Estimate (as of March 26, 2024): AUD 4.40
Deterra Royalties has earned its wide moat through its royalty on BHP’s Mining Area C, or MAC, iron ore operations. This rare asset is based on both cost advantage and intangible assets.
The intangible assets relate to the MAC royalty agreement among BHP BHP , BHP’s minority partners, and Deterra. The agreement sets out terms for royalty payments for iron ore produced from the MAC royalty area and additional payments for increasing mine capacity, and it defines the royalty area itself.
The cost advantage stems from both the low cost of acquiring the MAC royalty area and the low-cost iron ore production that underpins the royalty. The North and South Flank mines are expected to be close to the bottom quartile of the global cost curve at full capacity. High-quality resources are sufficient to underpin at least 30 years of life at North Flank and 25 years at South Flank, with additional development options nearby.
We think production is highly likely to continue even if iron ore prices crater, given the low-cost nature of MAC. This underpins the value of the intangible assets. The royalty is based on revenue rather than profits, and so isn’t directly affected by the margins BHP earns from MAC. If anything, the MAC royalty would likely benefit from inflation, assuming it ultimately steepens the cost curve and supports higher prices. Deterra has no operating costs and no capital costs but owns royalty rights on current and future developments in the royalty area. BHP is the primary counterparty and is in strong financial shape.
4 Undervalued Stocks in the Mining Industry
These companies don’t feature moats, but we still think they are materially undervalued.
- Newmont NEM
- Barrick Gold GOLD
- Iluka Resources ILU
- Whitehaven Coal WHC
This article was compiled by Emelia Fredlick.
The author or authors do not own shares in any securities mentioned in this article. Find out about Morningstar’s editorial policies .

The 10 Best Companies to Invest in Now These undervalued stocks of high-quality companies are attractive investments today. Margaret Giles
Trump Media Is Not a Meme Stock. It’s a Cryptocurrency Investors aren’t buying DJT for future cash flows. John Rekenthaler
Sponsor Center
This web app uses cookies to compile statistic information of our users visits. By continuing to browse the site you are agreeing to our use of cookies. If you wish you may change your preference or read about cookies
Or explore sectors:
Why rio tinto group's business model is so successful.

Rio Tinto Group business model canvas
Rio Tinto Group’s Company Overview
Rio Tinto Limited is a mining company. The company is focused on finding, mining, and processing of mineral resources. The company's operating Segments include Iron Ore, Aluminum, Copper & Coal, Diamonds & Minerals, and Other Operations. Its products include aluminum, copper, diamonds, gold, industrial minerals (borates, titanium dioxide, and salt), iron ore, thermal and metallurgical coal, and uranium. The company's activities span across the world and are represented in Australia and North America, with businesses in Asia, Europe, Africa and South America. Its Copper product group comprises approximately four copper operating assets and over six coal operations, which includes Australia and South Africa, as well as development projects. The Diamonds & Minerals product group comprises a suite of businesses, including mining, refining, and marketing operations across approximately five sectors. The Iron Ore product group operates iron ores, supplying the global seaborne iron ore trade.
Country: London
Foundations date: 1873
Type: Public
Sector: Industrials
Categories: Mining
Rio Tinto Group’s Customer Needs
Social impact:
Life changing:
Emotional: provides access, badge value
Functional: reduces effort, reduces risk, reduces cost, saves time, avoids hassles, organizes, integrates, quality, variety
Rio Tinto Group’s Related Competitors
Rio tinto group’s business operations.
Cross-selling:
Cross-selling is a business strategy in which additional services or goods are offered to the primary offering to attract new consumers and retain existing ones. Numerous businesses are increasingly diversifying their product lines with items that have little resemblance to their primary offerings. Walmart is one such example; they used to offer everything but food. They want their stores to function as one-stop shops. Thus, companies mitigate their reliance on particular items and increase overall sustainability by providing other goods and services.
Dynamic pricing:
This pattern allows the business to adjust its rates in response to national or regional trends. Dynamic pricing is a pricing technique known as surge pricing, demand pricing, or time-based pricing. In which companies establish variable prices for their goods or services in response to changing market conditions. Companies may adjust their rates based on algorithms that consider rival pricing, supply and demand, and other market variables. Dynamic pricing is widely used in various sectors, including hospitality, travel, entertainment, retail, energy, and public transportation.
Energy development is an area of study concerned with adequate primary and secondary energy sources to satisfy society's requirements. These activities include those that promote the development of conventional, alternative, and renewable energy sources and the recovery and recycling of energy that otherwise would have been squandered.
From push to pull:
In business, a push-pull system refers to the flow of a product or information between two parties. Customers pull the products or information they need on markets, while offerers or suppliers push them toward them. In logistics and supply chains, stages often operate in both push and pull modes. For example, push production is forecasted demand, while pull production is actual or consumer demand. The push-pull border or decoupling point is the contact between these phases. Wal-Mart is a case of a company that employs a push vs. a pull approach.
Guaranteed availability:
Guaranteed availability is a property of a business system that attempts to maintain an agreed-upon level of operational performance, often uptime, for a longer time than is typical. The idea is often linked with terms such as high availability and catastrophe recovery.
Ingredient branding:
Ingredient branding is a kind of marketing in which a component or ingredient of a product or service is elevated to prominence and given its own identity. It is the process of developing a brand for an element or component of a product in order to communicate the ingredient's superior quality or performance. For example, everybody is aware of the now-famous Intel Inside and its subsequent success.
Layer player:
Companies that add value across many markets and sectors are referred to be layer players. Occasionally, specialist companies achieve dominance in a specific niche market. The effectiveness of their operations, along with their economies of size and footprint, establish the business as a market leader.
The lock-in strategy?in which a business locks in consumers by imposing a high barrier to transferring to a competitor?has acquired new traction with New Economy firms during the last decade.
Historically, developing a standard touch sales model for business sales required recruiting and training a Salesforce user who was tasked with the responsibility of generating quality leads, arranging face-to-face meetings, giving presentations, and eventually closing transactions. However, the idea of a low-touch sales strategy is not new; it dates all the way back to the 1980s.
Make and distribute:
In this arrangement, the producer creates the product and distributes it to distributors, who oversee the goods' ongoing management in the market.
Orchestrator:
Orchestrators are businesses that outsource a substantial portion of their operations and processes to third-party service providers or third-party vendors. The fundamental objective of this business strategy is to concentrate internal resources on core and essential functions while contracting out the remainder of the work to other businesses, thus reducing costs.
Performance-based contracting:
Performance-based contracting (PBC), sometimes referred to as performance-based logistics (PBL) or performance-based acquisition, is a method for achieving quantifiable supplier performance. A PBC strategy focuses on developing strategic performance measures and the direct correlation of contract payment to success against these criteria. Availability, dependability, maintainability, supportability, and total cost of ownership are all standard criteria. This is accomplished mainly via incentive-based, long-term contracts with precise and quantifiable operational performance targets set by the client and agreed upon by contractual parties.
Reverse auction:
A reverse auction is a kind of auction in which the bidder and seller take on the roles of each other. In a conventional auction (also referred to as a forward auction), bidders compete for products or services by submitting rising bids. In a reverse auction, vendors fight for the buyer's business, and prices usually fall as sellers underbid one another. A reverse auction is comparable to a unique bid auction. The fundamental concept is the same; nevertheless, a bid auction adheres more closely to the conventional auction structure. For example, each offer is kept private, and only one clear winner is determined after the auction concludes.
Solution provider:
A solution provider consolidates all goods and services in a particular domain into a single point of contact. As a result, the client is supplied with a unique know-how to improve efficiency and performance. As a Solution Provider, a business may avoid revenue loss by broadening the scope of the service it offers, which adds value to the product. Additionally, close client interaction enables a better understanding of the customer's habits and requirements, enhancing goods and services.
Supply chain:
A supply chain is a network of companies, people, activities, data, and resources that facilitate the movement of goods and services from supplier to consumer. The supply chain processes natural resources, raw materials, and components into a completed product supplied to the ultimate consumer. In addition, used goods may re-enter the distribution network at any point where residual value is recyclable in advanced supply chain systems. Thus, value chains are connected through supply chains.
Embed code:
Recommended companies based on your search:
BHP Billiton Business Model
China minmetals business model, glencore business model.
Vizologi is a platform powered by artificial intelligence that searches, analyzes and visualizes the world’s collective business model intelligence to help answer strategic questions, it combines the simplicity of business model canvas with the innovation power of mash-up method .
See how Vizologi works View all features
You rock! Thank you for your interest. Before starting the canvas download, we would like to ask you to pay with a tweet.
Download paying with a tweet
Before downloading the canvas, we would like to invite you to our newsletter, from time-to-time we will send you curated content about business strategy
IMAGES
VIDEO
COMMENTS
The mining value chain ... Organizational enablement encompasses the operating model with restructured business units and a dedicated cross-functional team to dissolve silos and equip employees with the skills, especially around advancing technologies, they need to excel. It includes a mindset shift—perceiving the mining value chain as one ...
The term "business model" is used to describe how systems and people are organized to create, capture, and deliver value. Shown below is an illustration of the current business model of Mine Co. Government owns the mineral rights and gives Mine Co a permit to develop and operate a mine. In return royalties and taxes are paid by Mine Co to ...
Fig. 1 shows the business model of a standard mining company, called Mine Co. Once Mine Co determines that a mining project in a country is feasible, it applies to the country government (Government), the owner of the mineral rights, for a permit to develop and operate the mine. 2 Mine Co then invests the cost of constructing the mine and begins operation.
As a result, mining companies now need to look beyond traditional mine development methods (such as geology, mining and processing) and to new strategies to improve productivity and profitability. Mining IQ has summarized five considerations mining companies should contemplate when creating a mining business model for the future. 1.
Mining IQ has summarized five considerations mining companies should contemplate when creating a mining business model for the future. 1. Cost is only half the equation. Mining companies need to ...
Select mining companies have already begun their continuous improvement journey by applying these principles. Those that are focusing on operational excellence are seeing improvements in business results, with uplifts in production ranging from 1 to 16 percent and a reduction of safety incidents by 5 to 23 percent per annum (Exhibit 5).
Development of a mine—from exploration to production. The mining business case structure—from orebody to market. Team—A strong team will convince investors. Legal structuring—The mining business case needs a solid and simple legal structure. Financial analysis of the mining business case—the development of an economic model.
The Monash Business School's relationship with the mining sector is entering an exciting new period as companies experiment with new business models in exploration, production marketing and services. In practice this means that many of the industry's capabilities, which were staples for the industry for decades, have been and will continue ...
The purpose of the paper is to analyze the standard business model that still dominates the mining industry, followed by a comparison of recent scientific findings on sustainability-oriented ...
The mining industry is involved in the extraction of precious minerals and other geological materials. The extracted materials are transformed into a mineralized form that serves an economic benefit to the prospector or miner. Typical activities in the mining industry include metals production, metals investing, and metals trading.
The arrival of the precious-metals streaming business model is often attributed to Wheaton River: while seeking to raise funds in 2004 to expand its core business of gold mining, the company conceived the idea of streaming silver by-product from the San Dimas gold mine in Mexico to a new subsidiary company, Silver Wheaton.
Introduction. Since 2014 global regulators have published several articles concerning the need for mining business model reviews. Whilst a considerable emphasis is placed on a decade-long trend of ...
Asset-Light Mining is a model where a company owns mining equipment but does not fully own mining data centers. They rely on third-party co-location providers to host their equipment and pay hosting fees. ... Business Model. Pros. Cons. Examples. Asset-Light Mining. Less CapEx on infrastructure. Highly dependent on hosting partners. Marathon ...
The definitive guide to mining operations and excellence. Established in 1909 by Herbert Hoover, Mining Magazine provides comprehensive technical insight into mining operations. It aims to inform and support mine management in decision-making regarding mining techniques, technologies, workforce, logistics, and supply chains.
Mining's current business model. Fig. 1 shows the business model of a standard mining company, called Mine Co. Once Mine Co determines that a mining project in a country is feasible, it applies to the country government (Government), the owner of the mineral rights, for a permit to develop and operate the mine. 2.
Our business model explains how we aim to fulfil our strategic objectives, as well as how we create, preserve or erode value for our stakeholders over time. Inputs; ... MINING. In-country opportunities to leverage off our existing footprint, infrastructure and skills set, and capitalise on the experience we have gained from operating in these ...
The example model will help you get started with mining operations modeling. The source files are available for download in AnyLogic and in AnyLogic Cloud . In this blogpost, Focus Group Company share their mining simulation expertise and real models reflecting real-world business cases.
It creates a consistent description of mining businesses for enterprise architectures in mining companies, and for business managers. Outcome: Many mining companies are using the EMMM standard to describe their businesses. Stakeholders: Enterprise architects, business managers, operations, IT. Status: The EMMM standard was published in 2013.
Georg Kell, "The Remarkable Rise of ESG," Forbes, July 11, 2018, accessed September 17, 2019. View in article. Paula Laier, "Vale stock plunges after Brazil disaster; $19 billion in market value lost," Thomson Reuters, January 28, 2019, accessed October 1, 2019. View in article. The Church of England, "Investor Mining and Tailings Safety Initiative," The Church of England, October ...
The model was validated studying its ability to reproduce some "stylized facts" found in real-time price series and some core aspects of the real mining business. In particular, the computational experiments performed can reproduce the unit root property, the fat tail phenomenon and the volatility clustering of Bitcoin price series.
The analysis in this article was enabled by MineSpans, which is a proprietary McKinsey solution that provides mining operators and investors with robust cost curves, commodity supply and demand models, and detailed bottom-up models of individual mines.. For copper, MineSpans offers mine-level data on 390 primary copper mines and 170 secondary mines and tracks more than 300 active development ...
The bitcoin mining business model is a strong one, allowing for bitcoin mining companies to create bitcoin at structurally lower prices than the market and achieve high-profit margins when the price of bitcoin is high. Indeed, given economies of scale in procurement and operations, many top public miners have a marginal cost of production well ...
Sources: World Gold Council, Morningstar. Data as of Feb. 29, 2024. One Mining Stock With a Wide Moat. Most of the mining companies on our coverage list have large market capitalizations, operate ...
Vizologi is a platform powered by artificial intelligence that searches, analyzes and visualizes the world's collective business model intelligence to help answer strategic questions, it combines the simplicity of business model canvas with the innovation power of mash-up method. See how Vizologi works View all features. Rio Tinto Limited is ...